ENERGY SECTOR IN INDIA (Key Fundamental Ratios) (Copy)
# Analyzing Energy Stocks: Key Ratios and Their Impact
Investing in energy stocks requires a comprehensive understanding of various financial ratios. These ratios serve as vital indicators of a company's financial health, growth potential, and valuation. In this article, we will explore the significance of key ratios for analyzing energy stocks in the Indian context.
Valuation Ratios
Valuation ratios provide insights into the market value of a company's stock. They help investors determine whether a stock is overvalued or undervalued. The following valuation ratios are particularly relevant for analyzing energy stocks:
- Price to Earnings Ratio (P/E): The P/E ratio compares the market price of a company's stock to its earnings per share (EPS).
A high P/E ratio suggests that investors have high expectations for future earnings growth. Conversely, a low P/E ratio may indicate an undervalued stock.
- PEG Ratio: The PEG ratio combines the P/E ratio with the company's expected earnings growth rate. It offers a more comprehensive view of the stock's valuation relative to its growth potential.
A PEG ratio below 1 is generally considered favorable, indicating an undervalued stock.
- Price to Book Ratio (P/B): The P/B ratio compares a company's market price per share to its book value per share. It reflects the market's perception of the company's net asset value.
A P/B ratio below 1 suggests an undervalued stock, while a ratio above 1 may indicate overvaluation.
- EV/EBITDA: The EV/EBITDA ratio measures a company's enterprise value (EV) relative to its earnings before interest, taxes, depreciation, and amortization (EBITDA).
A lower ratio may indicate an attractive investment opportunity.
Profitability Ratios
Profitability ratios assess a company's ability to generate profits from its operations. They provide insights into the efficiency and effectiveness of a company's business model. The following profitability ratios are essential for analyzing energy stocks:
- Net Profit Margin: The net profit margin measures the percentage of revenue that translates into net profit after deducting all expenses.
A higher net profit margin indicates better profitability and cost management.
- Operating Profit Margin: The operating profit margin measures the percentage of revenue remaining after deducting operating expenses.
It reflects the profitability of a company's core business operations. Higher the better!
- Return on Assets (ROA): The ROA ratio evaluates a company's ability to generate profits relative to its total assets.
It indicates how effectively a company utilizes its assets to generate earnings. Higher the better!
- EBITDA Margin: The EBITDA margin measures a company's operating profitability by considering its earnings before interest, taxes, depreciation, and amortization.
It helps assess the company's operational efficiency. Higher the better!
Efficiency Ratio
Efficiency ratios provide insights into a company's effectiveness in managing its resources. In the context of energy stocks, the following ratio is particularly relevant:
- Inventory Turnover Ratio: The inventory turnover ratio measures how efficiently a company manages and sells its inventory.
It helps evaluate the liquidity and demand for a company's products or services. Higher the better!
Solvency Ratios
Solvency ratios focus on a company's ability to meet its long-term financial obligations. The following ratios are crucial for assessing solvency in the energy sector:
- Debt to Equity Ratio: The debt to equity ratio compares a company's total debt to its shareholders' equity.
It indicates the proportion of financing that comes from debt relative to equity. A higher ratio may suggest higher financial risk.
- Interest Coverage Ratio: The interest coverage ratio measures a company's ability to meet its interest payment obligations.
It assesses the company's capacity to generate sufficient earnings to cover its interest expenses.
Liquidity Ratios
Liquidity ratios evaluate a company's ability to meet its short-term obligations. The following ratios are important for analyzing the liquidity of energy stocks:
- Quick Ratio: The quick ratio measures a company's ability to pay off its short-term liabilities using its most liquid assets. It excludes inventory from current assets, focusing on assets readily convertible to cash.
- Current Ratio: The current ratio compares a company's current assets to its current liabilities. It helps investors assess whether a company has enough short-term assets to cover its short-term obligations.
Industry-Specific Ratios
The energy sector has unique industry-specific ratios that provide insights into a company's performance. The following ratios are particularly relevant:
- Reserve Replacement Ratio (for oil & gas production): The reserve replacement ratio measures an energy company's ability to replace the reserves it extracts. It helps evaluate its long-term sustainability and growth potential.
- Refinery Utilization Rate (for oil refining): The refinery utilization rate measures the percentage of a refinery's capacity that is actively being used. It reflects the efficiency and demand for refined oil products.
- Production Cost per Barrel/Unit: The production cost per barrel/unit is crucial for evaluating the efficiency and cost-effectiveness of energy companies' production processes.
Impact of Ratios on Different Market Capitalization Companies
How do large cap, mid cap, and small cap stocks behave in the energy sector in India?
One way to analyze the performance of the energy sector is to look at the market capitalization of the companies involved in this sector. Market capitalization or market cap refers to the total market value of a company's outstanding shares. It is calculated by multiplying a company's outstanding shares with the current market price of one share.
Based on their market cap, companies can be classified into three categories: large cap, mid cap, and small cap. Here are the general definitions of these categories:
- Large cap companies are those with a market cap above INR 20,000 cr. They are usually well-established and stable companies with a strong market presence and reputation. They tend to offer consistent returns and dividends to their investors, but may have lower growth potential than smaller companies.
Examples of large cap companies in the energy sector are Reliance Industries, NTPC, ONGC, Indian Oil Corporation, etc.
- Mid cap companies are those with a market cap between INR 5,000 cr and INR 20,000 cr. They are usually growing and expanding companies with a moderate market share and recognition. They tend to offer higher returns and growth potential than large cap companies, but also carry higher risks and volatility.
Examples of mid cap companies in the energy sector are Adani Green Energy, Adani Transmission, Torrent Power, JSW Energy, etc.
- Small cap companies are those with a market cap below INR 5,000 cr. They are usually new and emerging companies with a low market share and visibility. They tend to offer very high returns and growth potential than mid cap and large cap companies, but also carry very high risks and uncertainty.
Examples of small cap companies in the energy sector are Suzlon Energy, Inox Wind, Orient Green Power, Urja Global, etc.
The behavior of these different categories of stocks in the energy sector depends on various factors such as the demand and supply dynamics of energy sources, the regulatory environment and policies of the government, the competitive landscape and innovation of the industry, the global and domestic economic conditions and events, etc.
In general, large cap stocks tend to be more stable and resilient to market fluctuations than mid cap and small cap stocks. They also tend to have lower beta values than smaller stocks, meaning they are less sensitive to the movements of the broader market index. Large cap stocks may outperform smaller stocks in times of economic slowdown or uncertainty when investors prefer safety and reliability over risk and reward.
On the other hand, mid cap and small cap stocks tend to be more volatile and speculative than large cap stocks. They also tend to have higher beta values than larger stocks, meaning they are more sensitive to the movements of the broader market index. Mid cap and small cap stocks may outperform large stocks in times of economic recovery or growth when investors prefer risk and reward over safety and reliability.
However, these general trends may not always hold true for every company or every period. There may be exceptions where some large cap stocks may show higher growth or some small cap stocks may show lower risk than their peers. Therefore, it is important to analyze each company individually based on its fundamentals, financials, growth prospects, competitive advantages, etc.
In summary, analyzing energy stocks requires considering various financial ratios. These ratios provide insights into a company's valuation, profitability, efficiency, solvency, liquidity, and industry-specific performance. Understanding how these ratios impact different types of companies based on their market capitalization helps investors make informed investment decisions. By incorporating ratio analysis into their investment strategy, investors can better navigate the Indian energy stock market.
---
ENERGY SECTOR IN INDIA (Major Macroeconomic Factors) (Copy
How macro factors affect the energy stock prices in India
India is one of the fastest-growing economies in the world, with a huge demand for energy to power its development. The energy sector is a vital part of the Indian economy, contributing to about 15% of the GDP and employing millions of people. However, the energy sector is also influenced by various macroeconomic factors that can affect its performance and profitability. In this blog post, we will discuss some of the major macro factors that affect the energy stock prices in India and how they impact the investors.
Dollar Index
The dollar index is a measure of the value of the US dollar against a basket of six major currencies. It reflects the strength or weakness of the US dollar in the global market. The dollar index has a significant impact on the energy stock prices in India, as most of the energy commodities such as crude oil, natural gas, coal, etc. are priced and traded in US dollars.
A strong dollar makes these commodities more expensive for India, which imports about 80% of its oil and 50% of its gas needs. This increases the cost of production and reduces the profit margins for the energy companies.
A weak dollar, on the other hand, makes these commodities cheaper for India, which boosts the demand and profitability for the energy sector.
The dollar index also affects the foreign exchange rate of the Indian rupee against the US dollar.
A strong dollar depreciates the rupee, which increases the debt burden and interest payments for the energy companies that have borrowed in foreign currency. A weak dollar appreciates the rupee, which reduces the debt burden and interest payments for the energy companies that have borrowed in foreign currency.

GDP
GDP or gross domestic product is a measure of the total value of goods and services produced in a country in a given period of time. GDP reflects the economic growth and activity of a country, which in turn affects the energy demand and consumption.
A higher GDP implies a higher income level, higher industrial output, higher transportation activity and higher power generation, all of which require more energy.
Therefore, a higher GDP growth rate is generally positive for the energy sector and its stock prices, as it indicates a higher demand and revenue potential for energy companies.
However, GDP growth also depends on other factors such as investment, consumption, exports and imports, fiscal and monetary policies, etc.
For example, if GDP growth is driven by higher exports or lower imports, it may reduce the domestic energy demand and affect the energy sector negatively.
Similarly, if GDP growth is accompanied by higher inflation or interest rates, it may reduce the purchasing power and profitability of energy consumers and producers, respectively.

Inflation
Inflation is a measure of the general increase in the prices of goods and services in a country over time. Inflation affects the energy sector in two ways: directly and indirectly.
Directly, inflation affects the cost of production and distribution of energy, as well as the price of energy products. Higher inflation implies higher input costs such as wages, raw materials, transportation, etc., which reduce the profit margin of energy companies. Higher inflation also implies higher energy prices for consumers, which may reduce their demand and consumption of energy.
Indirectly, inflation affects the energy sector through its impact on other macroeconomic variables such as GDP growth, interest rates, exchange rates, etc. For example, higher inflation may lead to lower GDP growth or higher interest rates, which may reduce the energy demand and profitability.
Higher inflation may also lead to a depreciation of the domestic currency or an appreciation of foreign currencies, which may affect the energy trade and competitiveness.

Crude oil price
Crude oil price is a measure of the market price of crude oil ,which is one of the most important sources of energy in India.
Crude oil price affects the energy sector in two ways: directly and indirectly.
Directly, crude oil price affects the cost and revenue of oil-related segments such as oil exploration, refining, marketing, etc. A higher crude oil price implies a higher cost of importing crude oil, which increases the input cost and reduces the profit margin of oil-related companies.
It also implies a higher revenue from selling refined products such as petrol, diesel, kerosene ,etc, which increases the income potential of oil-related companies .
A higher crude oil price also implies a higher competitiveness of oil-related segments compared to other energy segments such as coal, gas, renewable , etc, as their products become more attractive in domestic and international markets .This may increase their market share and profitability in the energy sector.
Indirectly, crude oil price affects the energy sector through its impact on other macroeconomic variables such as inflation, exchange rate, GDP growth, etc.
For example, a higher crude oil price may lead to higher inflation or a depreciation of the domestic currency, which may reduce the purchasing power and profitability of energy consumers and producers, respectively. It may also lead to lower GDP growth, which may reduce the energy demand and consumption.

Geopolitical Factors
Political stability and geopolitical tensions in major oil-producing regions can have a direct impact on the availability and price of oil and gas. Conflicts or disruptions in these regions can lead to supply disruptions and price volatility, affecting the profitability of companies in these industries.
Economic Policy and Fiscal Environment
Government fiscal policies, such as tax incentives, subsidies, and investment regulations, can significantly influence the investment climate in these industries. Changes in economic policies can either encourage or discourage investment in oil refining/marketing, oil & gas production, integrated oil, and coal sectors.
Energy Transition and Environmental Concerns
The global shift towards cleaner and renewable energy sources, along with increasing concerns about climate change, can have long-term implications for the demand and consumption of oil, gas, and coal. Policies promoting renewable energy or carbon reduction targets may impact the future prospects and investment decisions in these industries.
Conclusion
In conclusion, we can see that the energy sector in India is influenced by various macroeconomic factors that affect the demand and supply of energy, as well as the cost and profitability of energy production and distribution. Therefore, investors should keep track of these factors and their movements to understand the performance and prospects of the energy sector in India.
---
ENERGY SECTOR IN INDIA (Overview) (Copy)

Overview
First Let’s Understand the Energy Sector
The energy sector is one of the most crucial elements for an economy. The industry includes the Oil & Gas industry, the Coal mining industry, the Power generating industry, and the power distribution industry. Despite the cyclical and volatile nature of the energy markets, accompanied by calls for more sustainable energy generation, energy stocks continue to exhibit gainful investment opportunities.
What is the Oil and Gas sector?
Crude Oil is the energy industry's primary component and the world's most important commodity. Oil & Gas includes products drawn out from crude oil extracted by oil drills. Crude oil is further refined to produce products such as petrol, diesel, ATF (aviation turbine fuel), kerosene, heating oil, LPG, and CNG among others.
Crude oil not only fulfills energy needs ranging from running cars to generating electricity but is also the key component used to create plastic, paints, lubricants, and asphalt (used for building roads) among others, making it key for energy and consumption.

The sector is divided into 3 segments:

Upstream segment – engaged in exploration and production (E&P) of crude oil. Companies in this segment are usually characterized with high investment capital, extended duration as it takes time to locate, drill and be technologically intensive. Examples include ONGC which is engaged in oil exploration and extraction.
Midstream segment – engaged in storage and transportation. Companies in this segment are characterized by shipping, trucking, pipelines, and storing of raw materials. The midstream segment is also marked by high regulation, particularly on pipeline transmission, and low capital risk. IOCL and GAIL are engaged in the storage and distribution of crude oil.
Downstream segment – engaged in refining, processing, and marketing of oil. E.g. IOCL and Reliance.
Overview of the Oil and Gas sector in India
India is the 3rd largest consumer of energy as well as oil. As on May 1, 2021, India’s oil refining capacity stood at 259.3 MMT (million metric tonnes), making it the second largest refiner in Asia.
India is pegged to increase this capacity to 667 MTPA (million tonnes per annum) by 2040. Private companies own about 35.19 percent of the total refining capacity in FY21.

The Oil and Gas industry offers multiple opportunities including:
Upstream Segment: 78% of the sedimentary area is yet to be explored; Secondary and Tertiary oil techniques.
Midstream Segment: Expansion of gas pipelines and LNG imports have increased, thereby giving an opportunity to boost production capacity in segments such as terminal operation, engineering, procurement and construction services.
Downstream Segment: India has 21 refineries and expansion is planned with FDI in export-oriented infrastructure, including product pipelines and export terminals; the development of CGD (city gas distribution) in many cities (including Tier 2 and 3 cities); and the expansion of the petroleum product distribution network.
Benefits of Investing in Energy Stocks
Energy is a key sector of the economy and will continue to see a rise in demand in the coming future, especially as India moves towards the goal of becoming a developed country. This increased demand will be met through both conventional and renewable sources of energy.
Additionally, by investing in energy stocks, investors can gain from capital growth and dividends. Many investors have earned handsome profits by investing in stocks like Reliance and Adani this year, which have returned spectacular results.
Finally, investing in energy sector stocks will help investors to diversify their portfolios. They can also gain diversification benefits by investing within the energy sector as these stocks deal with various sub-sectors, such as power, solar energy, oil & gas etc.
That’s all about the overview of the energy sector in general. In the next blog, we’ll talk about the financial ratios which we need to consider while analyzing the energy stocks.
---

Commodity SECTOR IN INDIA (Overview)
Overview
Commodity sector in India mainly consists of Chemicals, Construction Materials (mainly cement), Metals & Mining, and Forest Materials products including Paper, Forest &
Jute Products. In this blog post, we’ll try to get an overview of each industry one by one.
Chemicals Industry Overview
India's chemicals industry is a significant contributor to the country's economy and is expected to contribute $300 billion to India's GDP by 2025. The industry covers a wide range of products, with a market size of $178 billion in 2018-19, expected to grow to $304 billion by 2025.
India holds a strong position in global chemical exports and imports, ranking 14th in exports and 8th in imports (excluding pharmaceuticals). Alkali chemicals and polymers are major components of India's chemical production, with alkali chemicals accounting for around 71.9% of total production from April to July 2021.
The specialty chemicals sector in India is experiencing significant growth, with Indian manufacturers recording a CAGR of 11% in revenue between FY15 and FY21. India's share in the global specialty chemicals market has increased to 4%. The industry is expected to see a 50% YoY increase in capex in FY22 and a revenue growth of 19-20% YoY.
India is a major player in the exports of dyes, accounting for 16% of global production. Agrochemicals and petrochemicals are also important revenue components for India, with agrochemicals accounting for 50% of total production and petrochemicals consumption reaching 22 million tonnes in 2019-20.
The government of India supports the chemicals industry through initiatives such as reducing customs duty on imported products and promoting the 'Make in India' campaign. The industry has attracted strategic investors from countries like Japan, Korea, and Thailand, looking to diversify their supply chains from China.
To further boost the sector, the government has set a vision for 2034, focusing on improving domestic production, reducing imports, and attracting investments. The government plans to implement production-linked incentive systems and create a manufacturing ecosystem through the growth of clusters.

In summary, India's chemicals industry is a vital part of the economy, with a strong global presence in exports and imports. The specialty chemicals sector is witnessing significant growth, and the government is taking initiatives to support and enhance the industry's performance. With immense growth potential, the sector offers attractive investment opportunities for both domestic and international investors.
Construction Material Industry Overview
Construction Material industry mainly consists of Cement Manufacturing companies in India. Cement is a key ingredient for construction and infrastructure development.
India is the second-largest producer and consumer of cement in the world, after China. It has a production capacity of about 550 million tonnes per annum (MTPA) and a consumption of about 350 MTPA.
The demand for cement is driven by the growth of sectors such as housing, urban development, roads, railways, ports, airports, power, and irrigation. The demand is also seasonal, with higher demand in the post-monsoon period (October-March) and lower demand in the monsoon period (June-September).
The supply of cement is determined by the availability of raw materials, coal, power, transport, and logistics. The supply is also regional, with higher concentration in the southern and western regions of India.
The costs of cement production include raw material costs, power and fuel costs, freight and logistics costs, and taxes and duties. The costs vary depending on the location, type, and efficiency of the plant.
The prices of cement are influenced by the demand-supply dynamics, the level of competition, the government policies and regulations, and the bargaining power of customers and suppliers. The prices also vary depending on the region, type, and grade of cement.
The competition in the cement industry is intense, with over 50 players operating in the market. The industry is consolidated at the top, with the top 10 players accounting for about 70% of the market share. The industry is also fragmented at the bottom, with many small and medium players catering to local markets.

The segments of the cement market include residential, commercial, industrial, and infrastructure. Each segment has different drivers and challenges depending on the nature and scale of the projects.
Metals & Mining Industry Overview
India holds a significant advantage in the production and conversion costs of steel and alumina. Its strategic location enables export opportunities to develop, especially in fast-developing Asian markets. As of FY22, India had an estimated 1,425 reporting mines, with 525 mines reporting metallic minerals and 720 mines reporting non-metallic minerals.
Minerals are precious natural resources that serve as essential raw materials for various industries, and the growth of the mining industry is crucial for the overall industrial development of a nation. India is blessed with abundant reserves of both metallic and non-metallic minerals, which serve as a foundation for the expansion and advancement of the country's mining industry. India is largely self-sufficient in metallic minerals such as bauxite, chromites, iron ore, and lignite, as well as mineral fuels like coal and lignite. The mining industry has the potential to significantly impact GDP growth, foreign exchange earnings, and provide a competitive edge to end-use industries such as construction, infrastructure, automotive, and electricity generation by ensuring the availability of essential raw materials at reasonable rates.

The rise in infrastructure development and automotive production is driving the growth of the mining sector in India. Additionally, the power and cement industries are also contributing to its growth. Given the strong growth expectations for the residential and commercial building industry, the demand for iron and steel is expected to continue rising.
Commodity SECTOR IN INDIA (Key Fundamental Ratios)
FUNDAMENTAL RATIOS AFFECTING THE COMMODITIES SECTOR
Fundamental Ratios used to analyze stocks in the consumer discretionary sector can be divided into 5 categories- namely Valuation Ratios, Solvency Ratios, Profitability Ratios, Efficiency Ratios and Liquidity Ratios.
VALUATION RATIOS
Price to Earnings is an important valuation metric used to analyze companies across industries. A high P/ E indicates that the company is overvalued by the markets with respect to it’s earnings. Companies in the commodities sector have a moderate P/E ratio. Any government regulation restricting its operations can have a widespread adverse impact. The price to book Value can also be used to analyze if a stock is overvalued or not. The PEG ratio, which compares the price of a stock to the company’s earnings growth is another important valuation metric. The ideal PEG is 1 but companies in the Commodities sector have a quite adverse PEG ratio of -58 indicating negative earnings on average.
Dividend Yield compares the dividend provided to investors with the stock’s price. Undervalued stocks with high dividend yields are called Income stocks. Small cap stocks in the Commodities sector comprise mainly of Income stocks.
SOLVENCY RATIOS
Companies in the commodities sector have a debt to equity ratio below 1 on average. This is a good indicator of the financial health of a sector. Interest Coverage ratio is another financial metric used to assess the solvency of companies. Companies in this sector have a favorable Interest Coverage Ratio implying they have enough earnings to cover their interest expenses.
PROFITABILITY RATIOS
Net Profit Margin, which compares the profits of a company to its total revenue, is used industry wide to assess profitability of companies. The commodities sector tends to have a lower Net Profit margin in comparison to it’s peers. These companies have huge expenses with regard to daily operations and face a number of restrictions from regulatory authorities. Hence the lower margins. Return on Capital Employed, which compares the returns generated by the company to its capital investments is another great metric to assess the profitability of these companies as they are heavily capital intensive.
EFFICIENCY RATIOS
Fixed Assets Turnover ratio is a very useful financial metric to analyze the efficiency of companies in the commodities sector. It compares the revenue generated with the average investment in fixed assets. Given that this sector is heavily dependent on fixed assets such as Plant and Machinery for their operations, the ratio is a good measure of the company’s efficiency in operations.
The Inventory Turnover Ratio can also be used to analyze how efficiently the company is managing it’s inventory. The ideal Inventory Turnover Ratio is 12, which implies the inventory has been sold out once every month. Companies in the commodities sector have an average Inventory Turnover Ratio around 6 which is not ideal. One reason for the same might be that most of these companies deal in industrial products and do not face fast moving consumer demand that runs out inventory quicker.
LIQUIDITY RATIOS
Current Ratio compares the short term assets of a company to its short term liabilities. The average current ratio in the commodities sector is 1.74 which is less than the ideal value of 2. The Quick ratio, which compares the cash and cash equivalents to the short term liabilities hovers around 1 in the sector which is an ideal value.
Commodity SECTOR IN INDIA (Major Macroeconomic Factors)
Macros affecting the commodity sector in India
The commodity sector in India is influenced by various macroeconomic factors, such as inflation, exchange rate, interest rate, GDP growth, fiscal deficit, trade balance, and global commodity prices. These factors affect the demand and supply of commodities, as well as their price volatility and risk-return profile.
Inflation
One of the major macroeconomic factors affecting the commodity sector in India is inflation. Inflation is the general increase in the prices of goods and services over time. Inflation erodes the purchasing power of money and reduces the real income of consumers and producers. Inflation also affects the cost of production and transportation of commodities, which impacts their profitability and competitiveness. Inflation can be measured by various indices, such as the Wholesale Price Index (WPI), the Consumer Price Index (CPI), and the GDP deflator.
According to a study by Ch Murthy Chodi setty and Raja Babu (2018), there is a positive relationship between inflation and commodity futures volatility in India. They found that higher inflation leads to higher uncertainty and risk in the commodity markets, which increases the volatility of commodity prices. They also found that different commodities have different sensitivities to inflation, depending on their nature and usage. For example, agricultural commodities are more affected by inflation than industrial commodities, because they have a higher share of input costs in their production.
Exchange rates
Another important macroeconomic factor affecting the commodity sector in India is the exchange rate. The exchange rate is the price of one currency in terms of another currency. The exchange rate affects the competitiveness and profitability of exporters and importers of commodities, as well as their hedging strategies and risk exposure. The exchange rate also affects the domestic demand and supply of commodities, as well as their international price transmission.
The dollar index is one of the macroeconomic factors which affects the Indian Stock Markets greatly. Investors should note that there is an inverse relationship between the dollar index and the Indian stock market (ELM, 2021). A stronger dollar makes Indian exports more expensive and imports cheaper, which reduces the trade balance and lowers the demand for domestic commodities. A weaker dollar makes Indian exports cheaper and imports more expensive, which improves the trade balance and increases the demand for domestic commodities.

Other macroeconomic factors that affect the commodity sector in India are interest rate, GDP growth, fiscal deficit, trade balance, and global commodity prices. Interest rate affects the cost of borrowing and investing in commodities, as well as their opportunity cost and discount rate.
GDP growth reflects the overall economic activity and income level, which affects the demand and supply of commodities.

Fiscal deficit measures the gap between government revenue and expenditure, which affects the public debt and borrowing requirement, as well as the fiscal stimulus and monetary policy stance.
Trade balance measures the difference between exports and imports of goods and services, which affects the foreign exchange reserves and current account position.
Global commodity prices reflect the international demand and supply conditions, as well as the geopolitical events and environmental factors that affect the production and consumption of commodities.
In conclusion, macros affecting the commodity sector in India are complex and interrelated. They have significant implications for the performance and risk-return profile of commodity investors and traders. Therefore, it is important to monitor these factors regularly and analyze their impact on different commodities using various tools and techniques.
CONSUMER DISCRETIONARY SECTOR IN INDIA (Key Fundamental Ratios)
Fundamental Ratios used to analyze stocks in the consumer discretionary sector can be divided into 5 categories- namely Valuation Ratios, Solvency Ratios, Profitability Ratios, Efficiency Ratios and Liquidity Ratios.
VALUATION RATIOS
1. P/E Ratio
The price-to earnings ratio is an important valuation metric used to analyze companies across industries. Companies within the consumer discretionary sector tend to have a high P/E ratio and are consequently classified as Growth stocks. These stocks tend to be overvalued in light of the growth potential they face in a growing economy such as India, where incomes are on the rise and, along with it, discretionary spending. The price-to-book value can also be analyzed to determine if a stock is overvalued or not. Apart from the above two ratios, the dividend yield of a stock is an important metric that can greatly impact market sentiment surrounding the company. Undervalued Stocks, i.e., stocks with low P/E and P/B ratios that have a high dividend yield, are classified as income stocks. Auto stocks such as Maruti Suzuki have high growth potential and manage to provide above average dividend yields to investors without compromising on revenue growth rates. These companies are classified as Growth-Income stocks. Companies that do not belong to any of the above categories are classified as Core.

INFLATION
As can be observed from the graph below, the performance of the consumer discretionary sector is inversely related to inflation rates. Inflation is detrimental to the sector. Consumer discretionary products are highly price elastic in nature. This implies that even a tiny change in prices can cause a huge change in demand for these goods, adversely affecting the sector's revenues. A sharp drop was witnessed in inflation rates in the year 2018 as food prices cooled down. This had a positive impact on the consumer discretionary sector. High inflation, along with monetary tightening to combat the same, adversely affected the sector in 2022–2023.

INTEREST RATES
A drop in interest rates can be beneficial to the consumer discretionary sector. Low interest rates translate into low costs of production and further into lower prices, boosting demand and spending by consumers. Discretionary spending on cars, electronic equipment etc also increase as loans for the same can be availed at lower rates of interest. Accommodative monetary policies implemented by Central Banks across countries led to a decline in interest rates IN FY 21. Subsequently interest rates across the globe have been on the rise to help combat inflation rates, adversely affecting consumer spending.
EXCHANGE RATES
An increase in exchange rates will be favorable for export oriented sectors within consumer discretionary, such as auto and textiles. However, this can also raise the cost of production by making imports more expensive. If the latter occurs, demand for these goods will fall on account of high prices and cause a dent in the stock's value.

COMMODITY PRICES
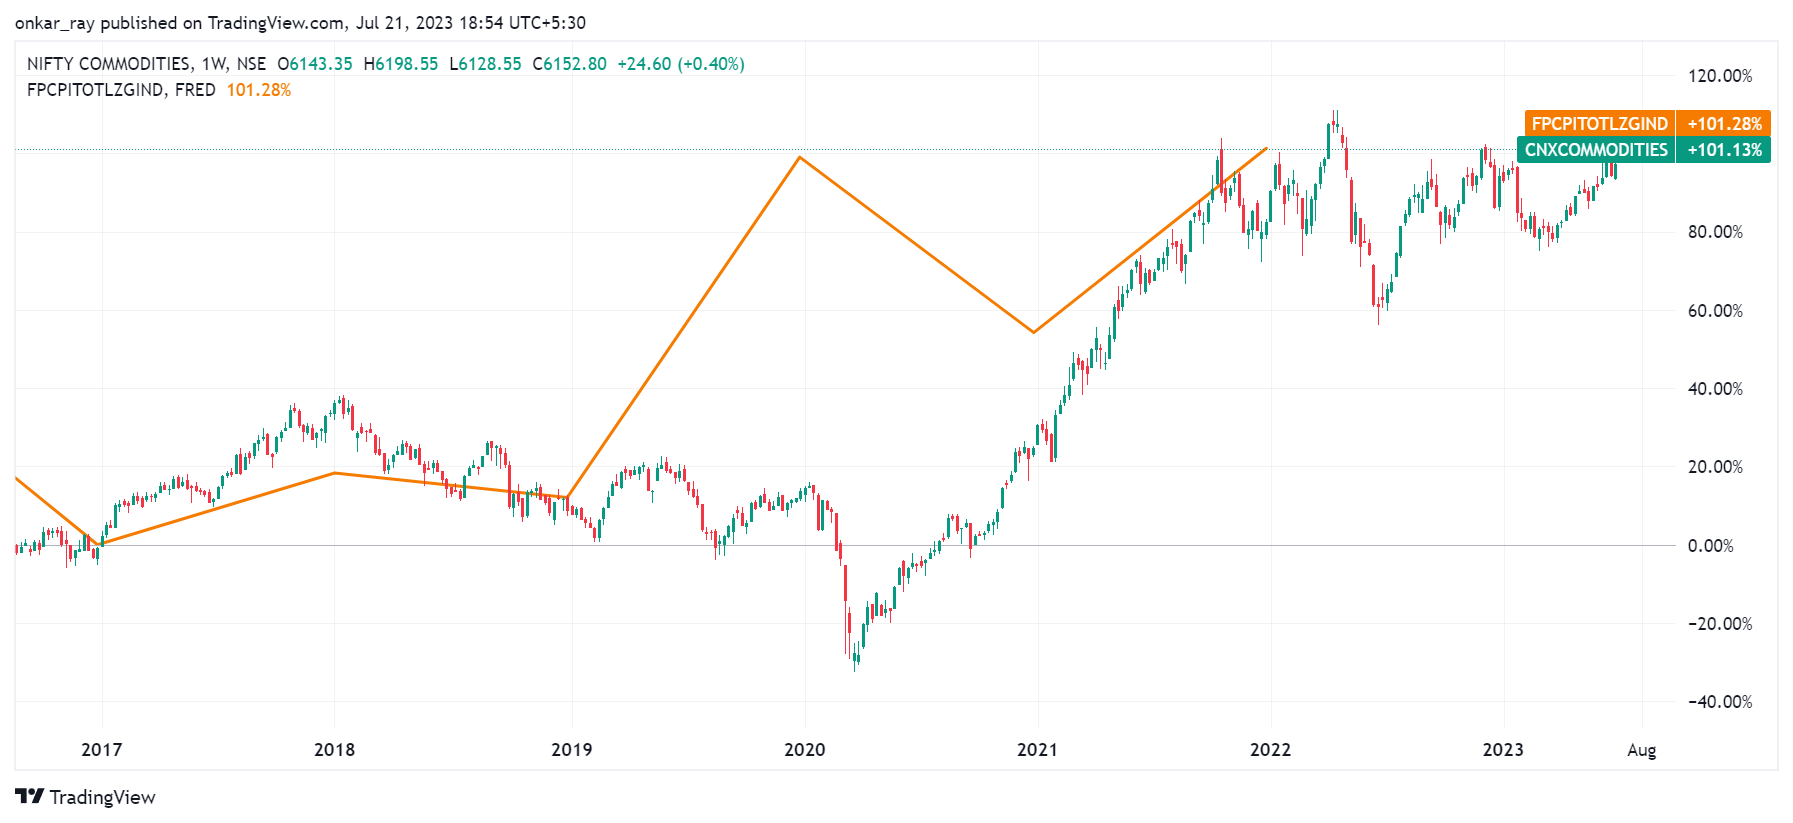
The performance of the consumer discretionary sector is inversely related to commodity prices, as can be seen in the graph. Increased commodity prices directly translate to higher production costs. Since this sector is highly price elastic, any rise in prices leads to a sharp fall in demand. Higher commodity prices can also erode the disposable income of individuals, leading them to spend less on discretionary items such as cars, media, etc.

CONSUMER DISCRETIONARY SECTOR IN INDIA (Major Macroeconomic Factors)
Gross Domestic Product (GDP)
Consumer Discretionary stocks are highly sensitive to the business cycle. Since these goods are not necessary for sustenance, a recession would imply decreased demand for consumer discretionary goods and hence a possible fall in the price of these stocks. These goods also have a high price elasticity to demand, implying that minor changes in prices can cause huge changes in demand. Any recessionary signals would induce consumers to spend less and save more, foregoing expenditure on non - essential items. Companies dealing in motor vehicles, media subscriptions, etc. would face a severe demand crunch during these times.
INFLATION
As can be observed from the graph below, the performance of the consumer discretionary sector is inversely related to inflation rates. Inflation is detrimental to the sector. Consumer discretionary products are highly price elastic in nature. This implies that even a tiny change in prices can cause a huge change in demand for these goods, adversely affecting the sector's revenues. A sharp drop was witnessed in inflation rates in the year 2018 as food prices cooled down. This had a positive impact on the consumer discretionary sector. High inflation, along with monetary tightening to combat the same, adversely affected the sector in 2022–2023.
INTEREST RATES
A drop in interest rates can be beneficial to the consumer discretionary sector. Low interest rates translate into low costs of production and further into lower prices, boosting demand and spending by consumers. Discretionary spending on cars, electronic equipment etc also increase as loans for the same can be availed at lower rates of interest. Accommodative monetary policies implemented by Central Banks across countries led to a decline in interest rates IN FY 21. Subsequently interest rates across the globe have been on the rise to help combat inflation rates, adversely affecting consumer spending.
EXCHANGE RATES
An increase in exchange rates will be favorable for export oriented sectors within consumer discretionary, such as auto and textiles. However, this can also raise the cost of production by making imports more expensive. If the latter occurs, demand for these goods will fall on account of high prices and cause a dent in the stock's value.
COMMODITY PRICES
The performance of the consumer discretionary sector is inversely related to commodity prices, as can be seen in the graph. Increased commodity prices directly translate to higher production costs. Since this sector is highly price elastic, any rise in prices leads to a sharp fall in demand. Higher commodity prices can also erode the disposable income of individuals, leading them to spend less on discretionary items such as cars, media, etc.
CONSUMER DISCRETIONARY SECTOR IN INDIA (Overview)
Overview
In India, the consumer discretionary sector includes companies involved in the production and distribution of non-essential goods and services. It encompasses a wide range of industries that cater to consumer preferences and discretionary spending.
These industries are driven by consumer preferences, discretionary income levels, lifestyle trends, and economic conditions. The sector is also influenced by factors such as changing demographics, urbanization, a rising middle-class population, increasing consumer spending, and the growth of e-commerce.
It's important to note that the consumer discretionary sector in India, like in any country, can have variations and nuances based on the specific market dynamics and regulations within the country. Consumer Discretionary mainly consists of large-cap companies, comprising 369 of the 543 stocks in the sector. There are 103 midcaps and 72 smallcaps.
Key subsectors within the consumer discretionary sector in India include:
Automobiles: Manufacturers and distributors of cars, motorcycles, commercial vehicles, and related components.
Consumer Durables: Companies involved in the production and sale of appliances, electronics, home furnishings, and other durable goods.
Retail: Various retail formats, including department stores, specialty stores, supermarkets, e-commerce platforms, and other retail chains.
Media and Entertainment: Companies involved in broadcasting, films, television, digital media, advertising, and entertainment services.
Hospitality and Leisure: Hotels, restaurants, travel services, amusement parks, and other leisure-related businesses.
Textiles: Producers/ Manufacturing units of various kinds of fabrics, such as cotton mills.
Real Estate: Companies dealing in commercial, industrial, residential, or other kinds of properties.
Historical Performance
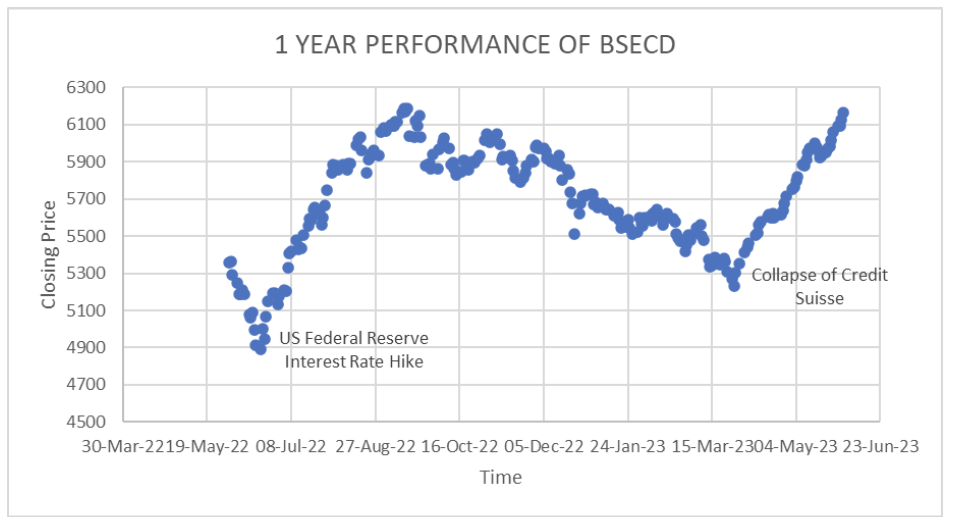
The BSECD is a composite index representing all stocks belonging to the consumer discretionary sector listed on the BSE. Over the past 10 years, the index has exhibited an overall trend of growth except for sharp declines occurring during events such as the COVID-19 pandemic and the collapse of banks.
While analyzing data pertaining to the period from March 2022 to June 2022, it can be observed that interest rate hikes across the globe led to a downward spike in stock prices. The banking turmoil of March 2023 adversely affected the stock market as a whole and, with it, the consumer discretionary sector..
The consumer discretionary sector has produced a return of 230% in terms of percentage change in price over the last 10 years, lower than its peers in industrials and Information Technology. Overall, it ranks third in terms of 10 year percent returns.