
NIO with Nobias technology: Is This Luxury EV Maker A Buy After Falling 43% From Its Highs?
Chinese technology stocks continue to be the talk of the town, as far as the Nobias credible author community goes. So many of these companies have turned into battleground stocks with investors offering strong opinions on either side of the bull/bear argument. And that’s no different for Nio (NIO), the Chinese electric vehicle (EV) maker, who reported earnings last week. NIO shares are down more than 43% from their 52-week high. And therefore, we wanted to see what the Nobias community had to say about the stock after its recent sell-off.
Chinese technology stocks continue to be the talk of the town, as far as the Nobias credible author community goes. So many of these companies have turned into battleground stocks with investors offering strong opinions on either side of the bull/bear argument. And that’s no different for Nio (NIO), the Chinese electric vehicle (EV) maker, who reported earnings last week. NIO shares are down more than 43% from their 52-week high. And therefore, we wanted to see what the Nobias community had to say about the stock after its recent sell-off.
On August 12th, NIO posted its second quarter results and beat analyst expectations on both the top and bottom lines. IAM News, a Nobias 4-star rated analyst, covered the earnings results in a recent article Benzinga, highlighting the print saying, “The start-up lost approximately $0.07 per share which translates to 0.42 yuan. This is less than both the expected loss of 0.68 yuan as well as the 1.15 yuan for the same period last year. Revenue surged 127.2% YoY as it amounted to $1.31 billion or 8.45 billion yuan, which topped the 8.32 billion yuan that Refinitiv analysts expected.”
The analyst notes that Nio remains an innovator in the battery space, which is paramount to success in the EV market. And, while there is a lot of competition in the EV space, Nio is attempting to set itself apart with a new battery swapping system. IAM news said, “Nio's battery swapping service makes it different from everyone else. It differentiates itself from competitors by offering special service stations to its users where they can swap their depleted battery for a fully charged one.”
During Nio’s Q2 conference call with investors, the company’s Founder and CEO, William Li highlighted his company’s unique battery swap system, saying, “Up until now, we have deployed 361 swap stations in 103 cities and completed over 3 million battery swaps for the users. In July, we announced NIO Power's battery-swap station deployment plan by 2025. We plan to increase the total number of battery-swap stations to over 700 by the end of 2021 and to over 4,000 globally by the end of 2025.”
The analyst highlights ongoing supply chain issues, specifically regarding the lack of semiconductor supply available to vehicle manufacturers which would delay its global product rollout. IAM News says that Nio had plans to expand into “EV haven Norway” in September, but right now, those plans remain up in the air.
However, even with macro uncertainty in place, NIO offered Q3 guidance. IAM News wrote, “As for the third quarter, revenues are expected in the range between 8.91 billion yuan and 9.63 billion yuan, which would translate to a rise between 96.9% to 112.8% compared to last year's quarter as it hopes to deliver between 23,000 and 25,000 vehicles.”
Li also touched upon that forward guidance, saying, “According to the data published by China Passenger Car Association, in the first half of 2021, the penetration rate of battery electric vehicles has reached 8.4% in China. NIO's penetration in the Tier 1 and the Tier 2 cities in China has been growing at a much faster pace. In Shanghai, the first half of this year has witnessed our penetration in the premium SUV segment, reaching 13.7% among all ICE and the electric vehicles. Our monthly order intake keeps it growing, but the delivery volume will be determined by the overall capacity of the supply chain. We expect the total delivery in the third quarter to be between 23,000 and 25,000 vehicles.”
When concluding their piece, IAM News notes that this remains a relatively small competitor in the global EV market. They say that Nio has lagged behind their peers in recent months when it comes to deliveries, which is worrisome in a world where first mover advantage and quickly capturing market share could make or break a company in this highly competitive industry. However, IAM News concludes, “Once EV adoption truly picks up, NIO has positioned itself well for the premium segment of the EV era with its innovative battery subscription business, its cutting-edge vehicles, and strong execution.”
The issue with so many of these tech stocks operating in cutting edge industries is valuation. Investors are forced to pay high premiums for the innovation that companies like Nio offer and oftentimes, it can be difficult to identify fair value because of the speculative nature of the premiums that investors have proven willing to pay.
In a July article, Mark R Hake, a Nobias 4-star rated analyst, published his value oriented analysis, pointing towards upside in NIo shares. Thinking about possible earnings-per-share of $0.27 in 2023, Hake wrote, “That would put NIO stock on a forward price-to-earnings (P/E) multiple of over 186 times earnings. Assuming EPS doubles over the next 2 years, the P/E would fall to a more normal 47 times. So, in effect, Nio stock does not seem to be out of touch with reality here.”

Nicholas Ward is a Senior Investment Analyst at Wide Moat Research. He has spent the last 8 years writing about the stock market at various publications, including Seeking Alpha, The Street, Forbes Real Estate Investor, Sure Dividend, The Dividend Kings, iREIT, Safe High Yield, and The Intelligent Dividend Investor.
Hake continued, highlighting the company’s price-to-sales multiple and comparing it to a major rival, saying, “Moreover, if we compare the price-to-sales (P/S) multiple to Tesla (TSLA), Nio definitely seems too cheap.” He noted that TSLA shares trade with a P/S multiple of nearly 10x and said: “If we apply those multiples to Nio the estimate is $87.2 billion (i.e., 9.87 x $8.83 billion). That is about the same as July 2’s market value of $87.17 billion. In addition, using the 2023 forecast of $12.85 billion in sales, using the Tesla multiple of 7.95 times, the market value will be $102.16 billion. This is 17.3% higher than July 2’s price.
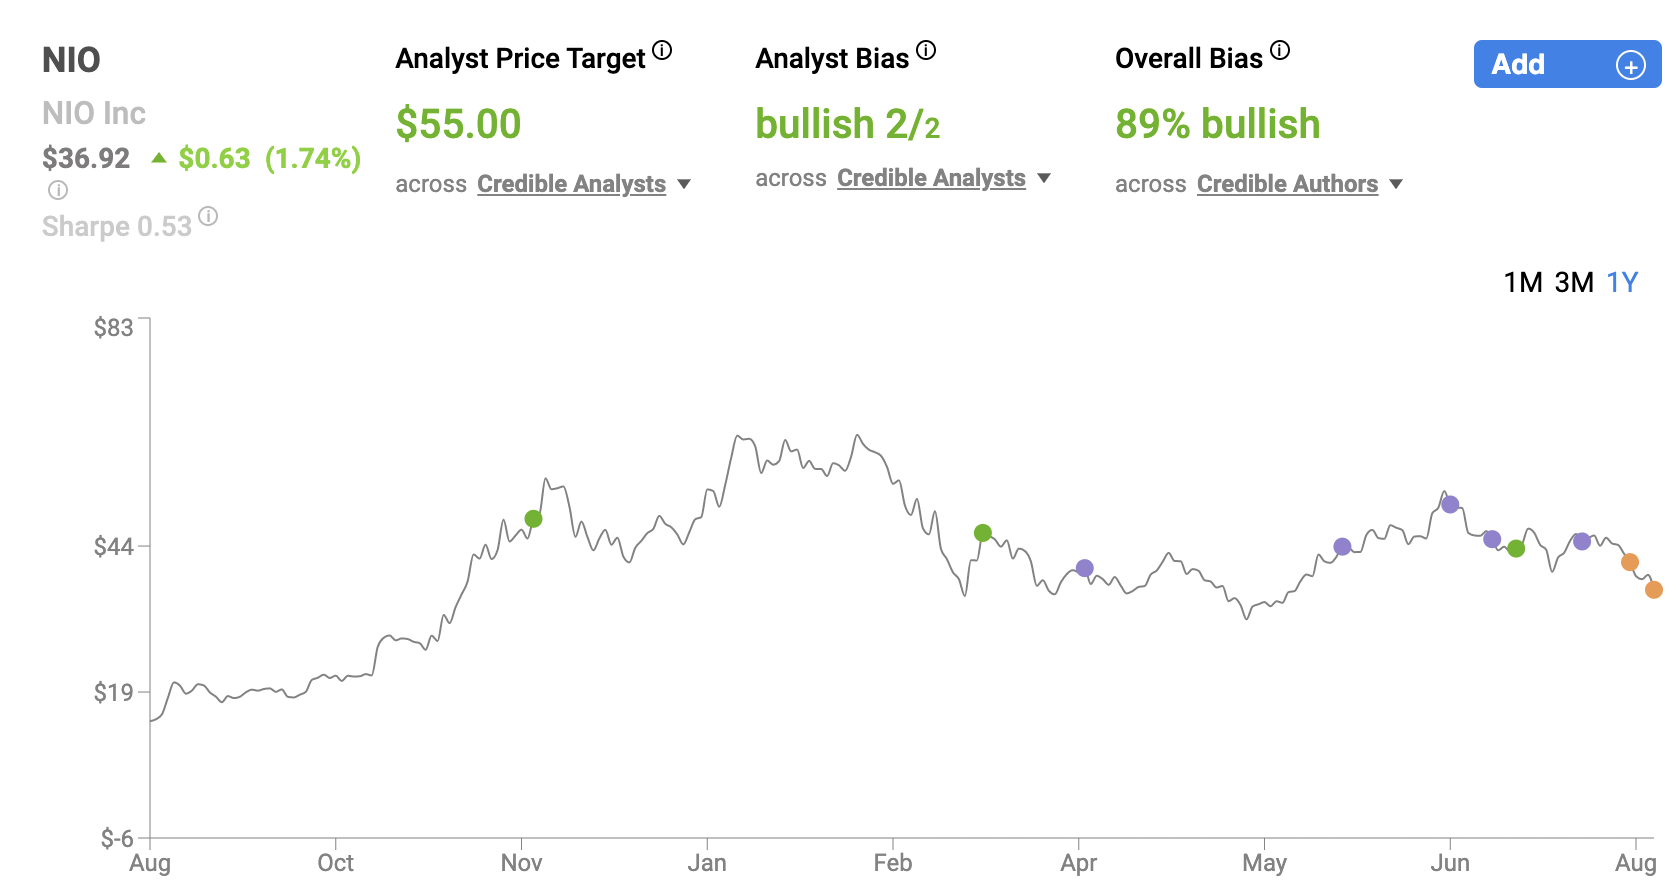
As a result, the implication is that Nio stock should be at $59.12 per share (i.e., 1.173 x $50.40). This is also close to what 22 Wall Street analysts say Nio stock is worth. Seeking Alpha’s survey of analysts shows that their average target price is $60.42 per share or 20% over the July 2nd price.” At the time, Nio was trading for approximately $50/share, and today, shares trade for $36.92, so NIO has fallen some 24% since Hake performed his due diligence, pointing towards even more upside potential.
Looking at the credible authors that we track with the Nobias algorithm, the average price target that these individuals place on NIO shares is $55.00 (so fairly close to the $60.42/share consensus that Hake mentioned). Compared to today’s $36.92 share price, the Nobias community’s consensus represents upside potential of 33%. With that in mind, it should come as no surprise that the vast majority of credible authors that we track remain bullish on shares, despite the stock’s recent pullback.
Disclosure: Nicholas Ward has no position in any stocks mentioned in this article. Nicholas Ward wrote this article for Nobias at their request with a view of giving investors a balanced perspective based on the writings of Nobias highly rated analysts and bloggers. Nobias has no business relationship with any company whose stock is mentioned in this article and does not have a position in this stock.
Additional disclosure: All content is published and provided as an information source for investors capable of making their own investment decisions. None of the information offered should be construed to be advice or a recommendation that any particular security, portfolio of securities, transaction, or investment strategy is suitable for any specific person. The information offered is impersonal and not tailored to the investment needs of any specific person.
Disclaimer: The Nobias star rating is based on past performance results and is not an indicator of future results. These past performance returns do not represent returns that any investor actually earned. Assumptions made include the ability to purchase the stocks recommended by the author under liquid markets where the transaction would be at the market price for the day. In reality, loss in liquidity may have a material impact on the returns that actually may have been earned. Further, returns are calculated without any including transaction costs, management fees, performance fees or expenses, or reinvestment of dividends and other income. This information is provided for illustrative purposes only.
Airbnb with Nobias technology: Can This Travel Stock Overcome Pandemic Headwinds?
Management seemed very excited about the future and Wall Street analysts have hopped on board that bullish train. Since the company’s Q2 report, we’ve seen three Wall Street analysts who’re rated 4 or 5 stars by the Nobias algorithm update their price targets on ANBN shares, all of which are much higher than the stock’s current price. Stephen Ju of Credit Suisse, who is rated 5 stars by our algorithm, updated his price target to $167. Ronald Josey, of JMP Securities, who is rated 4 stars by our algorithm, updated his price target to $180. Bernie McTernan of Needham, who is rated 4 stars by our algorithm, updated his price target to $200.
Back in June, before the rise of the Delta variant in the United States, Brian Withers, a Nobias 5-star rated analyst, recently discussed AirBnB in a Motley Fool podcast in which he and his colleagues highlighted the strong demand that the reopening of the economy has created for the travel/leisure company.
Regarding demand, Withers said, "Airbnb will have a great current quarter. Everyplace I want to travel is booked full on Airbnb, revenge travel is unreal this year. Outdoorsy, Airbnb for RVs will be a great buy for them. RVs on Outdoorsy are also fully booked everywhere." He highlighted the fact that he’s had to change recent trip plans for his family because of a lack of available lodging across numerous rental platforms.
Brian Stoffel, a Nobias 3-star rated analyst, who was also on the call, mentioned that, “Anecdotal evidence can get you in trouble as an investor.” That’s true. Investors should focus on the macro data when it comes to due diligence because that is what paints the most accurate picture.

Trevor Jennewine, a Nobias rated 4-star analyst who also writes for the Motley Fool highlighted the macro data in the travel/leisure space back in June as well, comparing Airbnb’s operational results to those of its largest peers in the hotel industry, which showed ABNB’s relative strength as far as revenue resiliency goes.
Jennewine looked at the 2019 full-year revenue produced by Airbnb, Hyatt, and Hilton, and compared that full-year figure to the trailing twelve month results starting at Q1, 2021. He notes that Airbnb’s comparative sales had fallen by 23%. Hilton’s sales were down 65% on a relative basis. And Hyatt was the worst performer, seeing its relative top-line performance down by 70%.
Jennewine concluded that, “Airbnb's resilience gives the company a tremendous advantage, but that competitive edge is compounded by the flexibility afforded to travelers. Guests can book stays in big cities, rural towns, and everywhere in between. Not only that, but Airbnb lists unique lodgings like adobes, castles, yurts, and treehouses. Put another way, Airbnb is the gatekeeper to a multitude of unique experiences. That should be a powerful growth driver as the travel industry rebounds.”
The Motley Fool contributors on the podcast agreed. They discussed their belief that the pandemic has changed consumers’ spending habits and highlighted why this likely bodes well for Airbnb. Along those lines, Withers said, “I actually think this is one of those things like Etsy has picked up a ton of customers throughout the coronavirus as people have gone on and tried it. I think Airbnb will be the same thing, is people will start to see the benefits of staying in somebody else's place.” He continued, saying, “I think it gives you more space, it gives you more options. It certainly as a family, we traveled with our family and our dog, it allows us to take our dog with us. It's just a great thing all around. I think that hotels will continue to be for business travelers, but this will be for reunions and people, families traveling and whatnot, will really gravitate toward the Airbnb way to travel.”
And, while this is obviously a speculative statement at this point in time, it does paint a bullish outlook for the stock, assuming that we don’t see another strong wave of COVID which puts people back into stay-at-home mode. In June, the re-opening trade was in full effect and it appeared like travel regulations, mask mandates, and social distancing may soon be a thing of the past. However, a lot has changed during the last month or so and now, with hospitals throughout various areas of the country filling back up, creating a shortage of beds in ICU units, it appears as though those who went all in on the re-opening trade got a bit ahead of themselves.
Airbnb reported its second quarter earnings on August 12th, 2021 and at first glance, it appears that the company lived up to Withers’ high expectations. Airbnb beat analyst consensus estimates on both the top and bottom lines. The company’s GAAP EPS came in at -$0.11/share, which was $0.32/share above the consensus target of -$0.43. ABNB’s sales totaled $1.34 billion during the quarter, which represented growth of 300% on a year-over-year basis.
Granted, Q2 of 2020 was the worst quarter than travel and leisure stocks have seen in decades, due to the onslaught of the COVID-19 pandemic throughout the spring and summer of 2020. But, even though the strong beat was expected, what appears to have surprised many analyst is the fact that Airbnb’s adjusted EBITDA came in at $217 million, which was not only well above the negative $397 million EBITDA figure that the company produced in Q2 of 2020, but it was above the negative $43 million bottom-line figure that Airbnb produced during Q2 on 2019 (prior to the COVID-19 pandemic).
During the company’s second quarter shareholder letter, Airbnb management offered bullish commentary saying, “Our Q2 results reflect the success of our efforts to prepare for the travel rebound, as well as our continued operating discipline. Q2 Nights and Experiences Booked nearly matched pre-COVID levels; GBV and revenue exceeded pre-COVID levels; net loss improved; Adjusted EBITDA was positive and demonstrated significant margin expansion; and active listings reached their highest level yet. In fact, in the last few weeks, we had our biggest night ever in the U.S. and our biggest night globally since the pandemic began, with more than 4 million guests staying at an Airbnb listing.”
Furthermore, in the “Outlook” section of the letter, Airbnb management highlighted future growth prospects saying, “In the near term, we believe revenue and Adjusted EBITDA provide clearer indications of quarterly performance. While the COVID-19 pandemic creates ongoing uncertainty for our future results, we expect Q3 2021 revenue to be our strongest quarterly revenue on record and to deliver the highest Adjusted EBITDA dollars and margin ever.”
Nicholas Ward is a Senior Investment Analyst at Wide Moat Research. He has spent the last 8 years writing about the stock market at various publications, including Seeking Alpha, The Street, Forbes Real Estate Investor, Sure Dividend, The Dividend Kings, iREIT, Safe High Yield, and The Intelligent Dividend Investor.
Management seemed very excited about the future and Wall Street analysts have hopped on board that bullish train. Since the company’s Q2 report, we’ve seen three Wall Street analysts who’re rated 4 or 5 stars by the Nobias algorithm update their price targets on ANBN shares, all of which are much higher than the stock’s current price. Stephen Ju of Credit Suisse, who is rated 5 stars by our algorithm, updated his price target to $167. Ronald Josey, of JMP Securities, who is rated 4 stars by our algorithm, updated his price target to $180. Bernie McTernan of Needham, who is rated 4 stars by our algorithm, updated his price target to $200.
Today, ABNB trades for $143.69. Overall, the average recent update was $171.75, which implies upside potential of 16.3%. Right now, looking at the overall community of credible authors tracked by the Nobias algorithm, we see that the average analyst price target is very similar, at $172.67.
Even though COVID-19 fears remain in place, 85% of the credible authors that we track express a “Bullish” opinion on shares. And therefore, it appears that Airbnb remains an attractive option for investors who’re looking to increase exposure to the travel and leisure (or more specifically, the lodging) area of the market.
Disclosure: Nicholas Ward has no position in any stocks mentioned in this article. Nicholas Ward wrote this article for Nobias at their request with a view of giving investors a balanced perspective based on the writings of Nobias highly rated analysts and bloggers. Nobias has no business relationship with any company whose stock is mentioned in this article and does not have a position in this stock.
Additional disclosure: All content is published and provided as an information source for investors capable of making their own investment decisions. None of the information offered should be construed to be advice or a recommendation that any particular security, portfolio of securities, transaction, or investment strategy is suitable for any specific person. The information offered is impersonal and not tailored to the investment needs of any specific person.
Disclaimer: The Nobias star rating is based on past performance results and is not an indicator of future results. These past performance returns do not represent returns that any investor actually earned. Assumptions made include the ability to purchase the stocks recommended by the author under liquid markets where the transaction would be at the market price for the day. In reality, loss in liquidity may have a material impact on the returns that actually may have been earned. Further, returns are calculated without any including transaction costs, management fees, performance fees or expenses, or reinvestment of dividends and other income. This information is provided for illustrative purposes only.
Baidu with Nobias technology: Down 55%, Is It Time To Buy “The Google of China”?
We recently covered Alibaba (BABA) in a quarterly update article and it appears that it isn’t the only Chinese tech giant that is being discussed frequently by analysts. Another company that popped up on our radar recently, with regard to an increase in analyst chatter, is Baidu (BIDU). Much like Alibaba, Baidu shares have suffered in a major way throughout 2021 due to increasing regulatory pressure being put onto the biggest players in the Chinese technology space by the Chinese Communist Party.
Not only have growth prospects been hurt by regulation that we’ve seen in recent month, but investors/analysts alike have rising concerns about the variable interest entity structure, which is what allows foreign investors to gain access to chinese companies in the stock markets, being ripped apart, therefore, creating a lot of international bag holders for Chinese equities.
It’s true that fear surrounding the dismantling of the VIE ownership structure by Chinese leadership is speculative. However, the threat alone changes the risk/reward calculus related to stocks like BABA and BIDU. Yet, anyone familiar with the stock market knows that sentiment tends to move share prices too far, whether we’re talking about bullish rallies or bearish sell-offs. And, with that in mind, we wanted to take a look at what the credible authors who’ve published work on BIDU have had to say recently, now that the BIDU shares have sold off by 55%, relative to their prior 52-week highs set in mid-February. Due to this weakness, it appears that institutional investors have become more and more interested in the rebound potential of BIDU shares.

Debasis Saha, a Nobias 4-star rated analyst, recently published a report which highlighted the increased demand for BIDU shares within the hedge fund community. Saha said, “Prominent investors were betting on the stock. The number of long hedge fund bets rose by 38 recently. Baidu, Inc. was in 89 hedge funds' portfolios at the end of March. The all time high for this statistic was previously 72. This means the bullish number of hedge fund positions in this stock currently sits at its all time high.” This is an interesting trend because it’s often thought that big institutional money is what drives markets. However, it’s clear that not everyone in the institutional space is bullish on BIDU.
Richard Saintvilus, a Nobias 4-star rated analyst, published a Q2 preview piece earlier this week which pointed out that famed growth investor, Cathie Wood of Ark Investments, sold out of her large BIDU stake recently. Saintvilus said, “China’s regulatory crackdown has sparked fears among U.S. investors that foreign investors will flee Chinese stocks. Cathie Wood's ARK funds recently sold off Baidu shares, among other China holdings, for the same reasons.”
However, Saintvilus also touched upon the stock’s recent pullback, saying that a contrarian stance may be a reasonable one to take at the moment. He wrote, “This pullback, however, might be a good opportunity for investors who have been on the sidelines.” Saintvilus says that Bidu, which is often referred to as the “Google of China” offers compelling growth, even outside of its search engine assets, which include “a stand-alone artificial intelligence (AI) semiconductor capabilities, as well as streaming and autonomous vehicles.”
Regarding Baidu’s future growth potential, Saintvilus also points out that “with consecutive quarters of strong earnings that has yielded tons of cash flow, Baidu is ready to put its cash to work, promising to boost its investments by some 30% annually over the next several years.” Coming into the Q2 results, Saintvilus said, “Currently trading at around $163, Baidu still has a consensus Street price target of $308 which implies close to 90% upside.”
This highlights the high potential of a contrarian bet being placed at today’s relatively low share price levels. However, the bullish hedge fund outlook and the high consensus price target being placed on shares coming into the second quarter by Wall Street wasn’t enough to inspire a bounce back.
BIDU reported its second quarter earnings recently (on August 12th), beating analyst estimates on both the top and bottom lines. However, as Zheping Huang, a Nobias 4-star rated analyst, recently pointed out in a Yahoo Finance article, the company’s forward looking guidance disappointed investors, sparking the most recent leg of the stock’s sell-off.
BIDU shares have fallen roughly 7% since their August 12th report and Huang highlighted the fundamentals driving the move saying, “Baidu Inc. delivered a conservative outlook for the current quarter as a resurgent pandemic outbreak in China overshadowed the internet search giant’s push into newer arenas like cloud and smart devices.Revenue for the three months ended June climbed 20% from a year earlier to 31.35 billion yuan ($4.8 billion), compared with the 30.9 billion yuan of estimates. The company predicted sales of 30.6 billion yuan to 33.5 billion yuan for the September quarter, versus the 33.1 billion yuan seen by analysts, saying that the recent increase in Covid-19 cases across large parts of China left business visibility “limited.”’
Nicholas Ward is a Senior Investment Analyst at Wide Moat Research. He has spent the last 8 years writing about the stock market at various publications, including Seeking Alpha, The Street, Forbes Real Estate Investor, Sure Dividend, The Dividend Kings, iREIT, Safe High Yield, and The Intelligent Dividend Investor.
In a separate Bloomberg article that Huang penned, he included the full quote, writing: “The Covid-19 situation in China is evolving and business visibility is limited,” Baidu said in a statement Thursday, adding that the preliminary view is subject to change. The stock market hates uncertainty, above all else, and anytime you have a management team offering guidance like this (however truthful and frank it may be) investors are likely to sell shares. And yet, even with this uncertain guidance in mind, when we look at the credible authors tracked by the Nobias algorithm, the vast majority of them remain bullish on BIDU shares.
Right now, 91% of credible authors maintain a bullish opinion. And, the average price target amongst these credible sources sits at $325.00/share, which is even higher than the overall Wall Street consensus. Today, BIDU trades for $159.63. Compared to the $325 average price target that we’re seeing, this implies upside potential of roughly 103.6%. Obviously that is a fantastic near-term return potential. It’s worth noting that analysts have been wrong about the direction of BIDU shares for most of 2021; however, it's undeniable that the risk/reward here is intriguing. Because of that, it appears that BIDU is a stock that investors with high degrees of intestinal fortitude (especially those who do not fear continued Chinese crackdowns on its tech sector) may want to consider. These shares certainly aren’t for the faint of heart, but it’s rare that we see such a large discrepancy between current share prices and the average price target of the credible analyst community tracked by our algorithm.
Disclosure: Nicholas Ward has no BIDU position; however, he is long several of Cathie Wood’s Ark Invest ETFs, including ARKK, ARKW, ARKG, ARKX, ARKQ, and ARKF. . Nicholas Ward wrote this article for Nobias at their request with a view of giving investors a balanced perspective based on the writings of Nobias highly rated analysts and bloggers. Nobias has no business relationship with any company whose stock is mentioned in this article and does not have a position in this stock.
Additional disclosure: All content is published and provided as an information source for investors capable of making their own investment decisions. None of the information offered should be construed to be advice or a recommendation that any particular security, portfolio of securities, transaction, or investment strategy is suitable for any specific person. The information offered is impersonal and not tailored to the investment needs of any specific person.
Disclaimer: The Nobias star rating is based on past performance results and is not an indicator of future results. These past performance returns do not represent returns that any investor actually earned. Assumptions made include the ability to purchase the stocks recommended by the author under liquid markets where the transaction would be at the market price for the day. In reality, loss in liquidity may have a material impact on the returns that actually may have been earned. Further, returns are calculated without any including transaction costs, management fees, performance fees or expenses, or reinvestment of dividends and other income. This information is provided for illustrative purposes only.
Alibaba with Nobias technology: Is The Regulatory Risk Worth The Reward?
In mid-April, we published an article, highlighting Alibaba (BABA). At the time, BABA shares were trading for approximately $238/share. Back then, Alibaba shares had fallen more than 25% since their 52-week highs and we highlighted the bull/bear arguments that credible authors were making for and against the stock, in the face of ongoing Chinese regulatory fears. Today, we see BABA shares trading for $191.66, which means that they’ve fallen another 19.4% and now trade with a 40% discount relative to their current 52-week high of $319.32.
In mid-April, we published an article, highlighting Alibaba (BABA). At the time, BABA shares were trading for approximately $238/share. Back then, Alibaba shares had fallen more than 25% since their 52-week highs and we highlighted the bull/bear arguments that credible authors were making for and against the stock, in the face of ongoing Chinese regulatory fears. Today, we see BABA shares trading for $191.66, which means that they’ve fallen another 19.4% and now trade with a 40% discount relative to their current 52-week high of $319.32.
The regulatory fears still represent the overwhelming headwinds for this stock. However, from a fundamental standpoint, Alibaba’s growth story remains intact. This is what makes BABA so intriguing. Relative to its big-tech counterparts in the United States, BABA shares look relatively cheap on a trailing and forward looking basis. However, investors continue to fear potential backlash that the company might face from the Chinese Communist Party as well as the threat of de-listing and/or the destruction of the variable interest entity (VIE) structure which allows for international investors to gain exposure to various Chinese equities.
Therefore, in this piece, we wanted to take another look at BABA shares to see what the 4 and 5-star analysts that we track at Nobias have recently said about the company in an attempt to see whether or not these are shares that investors should consider buying into weakness.
Billy Duberstein, a Nobias 5-star rated analyst, recently published an article on The Motley Fool titled, “Why Alibaba Stock Fell 13.9% in July”. In his piece, Duberstein began by highlighting the Ant Financial IPO which was canceled by Chinese regulators last year as well as the $2.8 billion fine that the Chinese government forced Alibaba to pay because of anticompetitive practices. However, he continued, highlighting the more recent weakness saying, “Last month, however, marked a whole new ball game for Chinese technology stocks broadly, especially those listed on U.S. exchanges. Thus, Alibaba's stock got cut down further with the rest of the sector.”

Regarding the more broad issues that big-tech names in China have been having with regulators, Duberstein wrote, “In the early part of the month, regulators banned DiDi Chuxing from app stores, citing violations of data collection and usage policies. However, many interpreted the move as retaliation against Didi for going through with its U.S. IPO, even after authorities apparently didn't want the company to do so.” Then, he continued, saying, “Regulators then decimated the online education sector, saying online education companies would be prevented from making a profit on after-school tutoring services.”
Duberstein also mentioned a crackdown on the food delivery industry in China with regard to maintaining minimum wages and mentioned that while Alibaba is not the industry leader in that space, the company “also competes in delivery through its Ele.me and Freshippo platforms.” All in all, he notes, BABA was not directly in the cross hairs of any of the recent Chinese government regulations. However, he notes, “Since Alibaba is a large component of many Chinese technology ETFs and index funds, it was hit along with the rest, despite most of July's crackdowns being directed at other companies.”
Duberstein summed up his piece, highlighting the company’s valuation, strong balance sheet, and continued leadership position in a handful of attractive industries with perceived secular tailwinds. However, he clearly stated that ongoing regulation is a “wildcard” for the company and therefore, this may not be the right stock for risk averse investors. He writes, “At a valuation of just around 20 times next year's earnings estimates, Alibaba's stock seems quite cheap, especially since it also has a healthy net cash position of around $50 billion and equity interests in many other companies. However, the Communist Party's crackdown on tech companies remains a big wild card. Still, for those willing to bet the regulatory onslaught will end at some point, Alibaba's leading positions in e-commerce and cloud computing could present an attractive long-term opportunity.”
Since our last article, BABA posted its second quarter earnings results. The outcome was mixed, with the company beating analyst consensus estimates on the bottom-line, but missing top-list expectations. Zheping Huang, a Nobias 4-star rated analyst, covered the company’s earnings report in an article on Yahoo Finance. Regarding the company’s fundamental performance, Huang said, “Revenue for the three months ended June climbed to 205.7 billion yuan ($31.8 billion), compared with the 209.4 billion yuan average of analyst estimates. Net income was 45.1 billion yuan, rebounding from a loss in the previous quarter following the record antitrust penalty. The company announced Tuesday it was boosting its share buyback program by 50% to $15 billion.”
Nobias 5-star rated analyst, Sam Quirke touched upon the strong quarterly results and the even more appealing valuation that the company appears to offer in his recent article saying, “The current downtrend has also pulled down Alibaba’s price-to-earnings ratio which is now at an appetizing 23. This is well below the mid-50s where it spent much of 2017, 2018, and 2019 and further boosts the risk/reward set up currently in play.”
Quirke continued, saying, “Any relaxation in government scrutiny or geopolitical tension would also go a long way to easing the downward pressure, but rest assured; this is a fast-growing e-commerce company that’s on track to service more than a billion unique customers annually in the coming years. It’s already trading at a significant discount and any further weakness should be viewed as a buying opportunity.” He wrote this piece on August 4th and the stock closed that trading session at $200.71. And, as Shanthi Rexaline, a Nobias 4-star rated analyst, pointed out in her recent piece, Duberstein and Quirke aren’t the only individuals who believe that BABA looks cheap after its recent sell-off.
On August 4th, Rexaline penned an article highlighting 3 analyst upgrades which came after Alibaba reported Q2 numbers. In her piece she wrote: “Needham analyst Vincent Yu maintained a Buy rating and $330 price target for Alibaba shares. Raymond James analyst Aaron Kessler reiterated a Strong Buy rating and $300 price target. KeyBanc Capital Markets analyst Hans Chung maintained an Overweight rating and lowered the price target from $270 to $250.”
Rexaline points out that the Needham analyst was bullish on Alibaba’s improving margins, which came in “better than expected despite investments.” She also touched upon the Needham analysts’ view that increased regulation could be a good thing for BABA, due to the fact that it could end up hurting the company’s competition. She quoted Vincent Yu who said, "We believe Alibaba is navigating the current regulatory environment well and is poised to grow in several business areas such as ride-hailing and food delivery, in which increased regulations can benefit the overall industry as some competition will be eliminated."
Regarding the Raymond James upgrade, Rexaline wrote, “Alibaba increased its share repurchase program from to $10 billion to $15 billion, the largest share repurchase program in its history, the analyst said.” Raymond James appears to be bullish on the buyback because they believe shares to be cheap; Rexaline highlighted this saying, “Alibaba's valuation, at 10 times the estimated market place EPS estimate for 2022, is attractive, the firm added.”
Nicholas Ward is a Senior Investment Analyst at Wide Moat Research. He has spent the last 8 years writing about the stock market at various publications, including Seeking Alpha, The Street, Forbes Real Estate Investor, Sure Dividend, The Dividend Kings, iREIT, Safe High Yield, and The Intelligent Dividend Investor.
Hans Chung was the most bearish analyst that Rexaline highlighted. He appears to have major concerns about ongoing regulation and the uncertainty that this creates. Rexaline wrote, “Uncertainty around regulation on industrywide data privacy and security issues is also an overhang, Chung said.” She also noted that Chung has worries about near-term guidance recently provided by the company, writing, “On the other hand, the analyst said revenue guidance for fiscal year 2022 appears unachievable.” However, even with these headwinds in mind, low valuation appears to outweigh growth concerns because Chung’s price target of $250 still represents upside potential of roughly 30% from here.
Due to the ongoing volatility that BABA shares experience in the market today, this stock certainly isn’t for the faint of heart. However, it’s rare that investors have the chance to buy into such a well established company posting 30%+ growth that are trading with market multiples. Looking at the credible authors that Nobias tracks, it appears that the broader community shares the bullish sentiment expressed by these 3 Wall Street analysts.
At this point in time, the regulatory headwinds that BABA faces are well known; however, 91% of the credible authors that our algorithm tracks have a bullish opinion of Alibaba shares. In short, it appears that the Nobias community of credible analysts believe that the risk is worth the reward when it comes to BABA shares.
Disclosure: Nicholas Ward has no BABA position. Nicholas Ward wrote this article for Nobias at their request with a view of giving investors a balanced perspective based on the writings of Nobias highly rated analysts and bloggers. Nobias has no business relationship with any company whose stock is mentioned in this article and does not have a position in this stock.
Additional disclosure: All content is published and provided as an information source for investors capable of making their own investment decisions. None of the information offered should be construed to be advice or a recommendation that any particular security, portfolio of securities, transaction, or investment strategy is suitable for any specific person. The information offered is impersonal and not tailored to the investment needs of any specific person.
Disclaimer: The Nobias star rating is based on past performance results and is not an indicator of future results. These past performance returns do not represent returns that any investor actually earned. Assumptions made include the ability to purchase the stocks recommended by the author under liquid markets where the transaction would be at the market price for the day. In reality, loss in liquidity may have a material impact on the returns that actually may have been earned. Further, returns are calculated without any including transaction costs, management fees, performance fees or expenses, or reinvestment of dividends and other income. This information is provided for illustrative purposes only.
Teladoc with Nobias technology: Down 51% From Its Highs, Is It Finally Time To Buy?
During 2020, Tele-medicine took the world by storm. The pandemic forced the digital medicine trend onto consumers, ushering in years of growth expectations in just months. And from a stock market standpoint, Teladoc (TDOC) was the major beneficiary of this trend, seeing its shares rise from roughly $80 at the beginning of 2020 to recent highs of $308. However, throughout 2021, we have seen TDOC experience significant weakness. Today, TDOC shares are trading for just $149.26, down more than 51% from their prior highs. Teladoc recently posted Q2 earnings and with that in mind, we wanted to take a look at the company’s results and see what the credible authors tracked by the Nobias algorithm had to say about the stock’s prospects moving forward.
During 2020, Tele-medicine took the world by storm. The pandemic forced the digital medicine trend onto consumers, ushering in years of growth expectations in just months. And from a stock market standpoint, Teladoc (TDOC) was the major beneficiary of this trend, seeing its shares rise from roughly $80 at the beginning of 2020 to recent highs of $308. However, throughout 2021, we have seen TDOC experience significant weakness. Today, TDOC shares are trading for just $149.26, down more than 51% from their prior highs. Teladoc recently posted Q2 earnings and with that in mind, we wanted to take a look at the company’s results and see what the credible authors tracked by the Nobias algorithm had to say about the stock’s prospects moving forward.
In an article titled, “Is It Too Late to Buy Teladoc Stock?” that Nobias 5-star rated analyst, Zhiyuan Sun penned in late July, the author touched upon TDOC’s recent weakness, noting that it has been one of the worst performers in the healthcare sector during 2021, saying, “Investors are becoming increasingly skeptical of the company's ability to operate a digital consultation platform outside of pandemic conditions -- and they are not wrong to be dubious.” It’s clear that this 5-star rated analyst is not a fan of TDOC stock, due primarily for valuation reasons.
Sun highlighted the company’s continued success on the top-line; however, as he notes, TDOC is struggling to generate a profit. He wrote, “During Q1, Teladoc's total revenue increased by 183% year over year to $453.7 million as it facilitated 4.28 million sessions, up 109% from year-ago levels. It did not take many steps to improve its profitability, however, and its net loss widened to $199.6 million from Q1 2020's loss of $29.6 million.”

TDOC issued full-year guidance at the end of its Q1 report, putting a spotlight on its plans to generate approximately $2 billion via roughly 13 million digital visits. However, Sun believed that the company is going to have a hard time meeting those goals saying, “Unfortunately, Teladoc's peak performance is arguably behind it -- and the company may have significant problems meeting its guidance. Telehealth use has already fallen by 37% from its pandemic highs.”
Sun concluded his bearish piece saying, “In addition, its strategy of growing membership and visit count at a loss isn't helping its profitability situation. The stock looks extremely expensive at 11.8 times revenue. Investors who still want Teladoc in their portfolios would be well advised to wait for its valuation to come down even further before buying this healthcare stock on the dip.” Since he wrote his article, TDOC shares have been fairly flat, so the dip he’s looking for hasn’t yet occurred. But, Q2 earnings were posted on July 27th. In the immediate aftermath of those results, TDOC shares sold off some 10%. However, they quickly rebounded and another Nobias 5-star rated analyst, Keith Speights, who covers healthcare stocks at The Motley Fool, believed that the comeback was warranted.
In a recent article, Speights wrote, “With such a steep sell-off, you might think that Teladoc has big problems. However, the healthcare stock rebounded later in the morning on Wednesday as investors more fully digested Teladoc's news. My view is that this comeback is warranted. I believe that there was a lot of good news in the virtual care leader's second-quarter conference call that shouldn't be overlooked.”
Speights touched upon the company’s bottom-line woes saying, ‘Investors seemed to initially focus mainly on Teladoc's Q2 net loss of $133.8 million, or $0.86 per share. That result was a lot worse than the consensus analysts' estimate of a net loss of $0.56 per share. However, I think that Teladoc's bottom line isn't nearly as bad as it might seem.” He went on to explain that “Most of it stemmed from acquisition-related expenses related to Teladoc's purchases of Livongo Health and InTouch Health. Both are investments that I fully expect will pay off nicely for Teladoc over the long run”.. And, as Speights points out, “The rest of Teladoc's net loss was due to the company paying down debt. As with the acquisition-related expenses, my view is that the debt reduction is a story of short-term pain but long-term gain.”
Instead of focusing on earnings-per-share, Speights says that there are other, more important metrics that investors should be tracking when it comes to Teladoc’s performance. He wrote, “Perhaps the most important metric to watch is Teladoc's revenue per member per month (PMPM). In Q2, the company reported $2.47 in revenue PMPM. That's an increase of 142% over the prior-year period. It also reflected a 10.3% quarter-over-quarter jump.” When concluding his bullish piece, Speights said, “If I had to single out just one thing from Teladoc's Q2 update as a reason for buying the stock, it would be that the company's future appears to be brighter than ever.” He touched upon several statements that TDOC’s CEO, Jason Gorevic, made during the company’s quarterly report.
Gorevic mentioned that Teladoc’s new agreement with HCSC, which Speights points out is “the fifth-biggest health insurer in the U.S”, was “a landmark deal” for the company. Speights said, “The company expects the HCSC contract will drive growth beginning in early 2022 that will extend over a three-year period at least.” Gorevic also said that his company’s "late-stage pipeline at this point is 20% greater than it was last year."
In Speights view, this bodes well for growth, and ultimately, TDOC’s fundamentals eventually justifying today’s speculative valuation. In terms of Sun’s call that TDOC would have a hard time meeting its full-year guidance figures, during the Q2 report, TDOC management reaffirmed full-year revenue guidance, calling for:
Total revenue to be in the range of $2,000 million to $2,025 million.
EBITDA to be in the range of $(120) million to $(100) million.
Adjusted EBITDA to be in the range of $255 million to $275 million, including an estimated $20 million in lower expenses primarily related to Livongo devices as a result of the merger.
Net loss per share, based on 157.4 million weighted average shares outstanding, to be between $(3.60) and $(3.35).
Total U.S. paid membership to be in the range of 52 million to 54 million members and visit fee only access to be available to approximately 22 million individuals.
Total visits to be between 13.5 million and 14.0 million.
Nicholas Ward is a Senior Investment Analyst at Wide Moat Research. He has spent the last 8 years writing about the stock market at various publications, including Seeking Alpha, The Street, Forbes Real Estate Investor, Sure Dividend, The Dividend Kings, iREIT, Safe High Yield, and The Intelligent Dividend Investor.
In short, while the company is still struggling to generate profits, its client relationships continue to grow and while it’s unclear whether or not we have seen peak digital healthcare visits as society reopens and the world emerges from the COVID-19 pandemic, TDOC felt confident enough to maintain guidance for 2021 (at least).
While these two 5-star rated analysts provided compelling bull/bear arguments, overall, we see that the vast majority of the credible analysts that we track with the Nobias algorithm remain bullish on TDOC shares. Right now, 78% of credible authors have a “Bullish” opinion on the stock, with an average price target of $189.67, which implies upside potential of approximately 27%. Since the company’s Q2 earnings report, we’ve seen five different 5-star rated analysts update their price targets on TDOC shares.
Ryan MacDonald of Needham came in at $205/share. Stephanie Davis of SVB Leerink came in at $218. Donald Hooker of Keybanc updated his price target to $180. Michael Wiederhorn of Oppenheimer had the highest price target of the blue chip analysts that we track, at $220. And George Hill of Deutsche Bank was the only 5-star rated analyst who came in at “Neutral” as opposed to “Buy” with a $153 target. All in all, the average post-Q2 price target came in at $195.20, implying upside potential of nearly 31%.
Disclosure: Nicholas Ward has no position in any stock mentioned in this article. Nicholas Ward wrote this article for Nobias at their request with a view of giving investors a balanced perspective based on the writings of Nobias highly rated analysts and bloggers. Nobias has no business relationship with any company whose stock is mentioned in this article and does not have a position in this stock.
Additional disclosure: All content is published and provided as an information source for investors capable of making their own investment decisions. None of the information offered should be construed to be advice or a recommendation that any particular security, portfolio of securities, transaction, or investment strategy is suitable for any specific person. The information offered is impersonal and not tailored to the investment needs of any specific person.
Disclaimer: The Nobias star rating is based on past performance results and is not an indicator of future results. These past performance returns do not represent returns that any investor actually earned. Assumptions made include the ability to purchase the stocks recommended by the author under liquid markets where the transaction would be at the market price for the day. In reality, loss in liquidity may have a material impact on the returns that actually may have been earned. Further, returns are calculated without any including transaction costs, management fees, performance fees or expenses, or reinvestment of dividends and other income. This information is provided for illustrative purposes only.
Chevron with Nobias technology: Does This Oil Stock Have More Room To Run After Its 20.5% Year-to-Date Performance?
In 2020, when the COVID-19 pandemic began, forcing governments across the world to enact travel restrictions and other social distancing regulations, demand in the energy markets fell off of a cliff. We saw the price of a barrel of oil plummet and the “big oil” companies all saw their operational performances, and therefore, their share prices, suffer. In 2020, the energy sector was the worst performing area of the S&P 500, down more than 33%. However, when the “reopening” rally occurred during the first quarter of 2021, the energy space was a major beneficiary. Throughout much of 2021, we’ve seen Investors migrate out of the “stay-at-home” stocks, which were largely centered in the tech sector, due to the acceleration of trends related to the digital workplace, and into the more economically sensitive, cyclical stocks, because of the thesis surrounding a rapidly reflating global economy.
In 2020, when the COVID-19 pandemic began, forcing governments across the world to enact travel restrictions and other social distancing regulations, demand in the energy markets fell off of a cliff. We saw the price of a barrel of oil plummet and the “big oil” companies all saw their operational performances, and therefore, their share prices, suffer. In 2020, the energy sector was the worst performing area of the S&P 500, down more than 33%. However, when the “reopening” rally occurred during the first quarter of 2021, the energy space was a major beneficiary.
Throughout much of 2021, we’ve seen Investors migrate out of the “stay-at-home” stocks, which were largely centered in the tech sector, due to the acceleration of trends related to the digital workplace, and into the more economically sensitive, cyclical stocks, because of the thesis surrounding a rapidly reflating global economy.
This change of sentiment sent energy from worst to first, in terms of year-to-date performance. It wasn’t long ago that the energy sector was up more than 45% of a year-to-date basis. However, with the rise of the Delta variant, the migration from secular growth into cyclical value has experienced a speed bump, and over the last month, the energy space has become the S&P 500’s worst performing sector, down more than 7.2%.

Energy is still the best performing sector on a year-to-date basis, up 30.3% after the recent sell-off. However, with the threat of another strong COVID-19 wave on the horizon, investors are questioning whether or not we’ll see demand for oil remain elevated.
This has caused weakness in shares on oil/gas related stocks, even though their recent earnings reports beat analyst expectations. It appears that investors are at a crossroads when it comes to “big oil” and with that in mind, we wanted to take a look at Chevron (CVX), which just beat Wall Street’s expectations on both the top and bottom lines.
Martin Baccardax, a Nobias 4-star rated analyst who writes for TheStreet covered CVX’s recent earnings report in an article highlighting the company’s surprisingly good results and renewed buyback plan. He began by highlighting CVX’s bottom-line beat, saying, “Chevron said adjusted earnings for the three months ending in June came in at $1.60 per share, up from a $1.59 per share loss over the the same period last year and four cents ahead of the Street consensus forecast.”
Baccardax then moved to the top-line numbers, saying, “Group revenues, the company said, surged 178% higher from last year to $37.6 billion, again topping analysts' estimates of a $34.7 billion tally.” Baccardax highlighted an earnings related quote from Chevron’s CEO, Mike Wirth which read, “Second quarter earnings were strong, reflecting improved market conditions, combined with transformation benefits and merger synergies. Our free cash flow was the highest in two years due to solid operational and financial performance and lower capital spending.”
Baccardax also highlighted the fact that Wirth said that the company will resume share repurchases in Q3, “at an expected rate of $2 billion to 3 billion per year.” This is bullish for shareholders because it shows that management is confident enough in its cash flows to provide cash to shareholders while still managing its balance sheet and capex requirements.
With regard to shareholder returns and the strength of CVX’s dividend in particular, Rekha Khandelwal, a Nobias 5-star rated analyst who writes for The Motley Fool, recently published an article highlighting CVX’s recent dividend increase. She said, “With a 4% dividend increase for the first quarter, 2021 is Chevron's 34th consecutive year of dividend growth. Not many energy companies can boast of that long of a dividend growth streak. BP and Royal Dutch Shell both slashed their respective payouts last year due to an extremely tough market for oil and gas. Since 2005, Chevron's dividend has grown at a compound annual growth rate of more than 7%.”
However, even while being generous to shareholders, Khandelwal notes that the company has invested enough into growth and exploration projects to maintain its output levels. She wrote, “Chevron's five year reserve-replacement ratio is 99%, which shows that it can largely sustain its production at current levels without exhausting its proved reserves.” Khandelwal continued, saying, “The company expects $14 billion of capital and exploratory expenditure in 2021. Between 2022 to 2025, it expects to spend an average of $14 billion to $16 billion in capital and exploratory projects. That should help it maintain its reserve-replacement ratio close to 100%.”
Lastly Khandelwal highlighted the company’s alternative energy investments, touching upon its partnership with Toyota Motors in hydrogen technology development, before saying, “Moreover, Chevron continues to invest in low-carbon technologies through venture investments in geothermal, wind, and other clean energy projects. That hedges the company's dependence on oil and gas in the very long-term, should their use decline quicker than expected. At the same time, this approach allows it to continue generating cash from its established oil and gas business.”
All in all, Khandelwal believes that the combination of “an established track record of dividend growth, capital discipline with a focus on growth, a strong balance sheet, and openness to emerging low-carbon technologies'' paints a bullish picture for CVX shares. This is why she named Chevron her top energy pick in the month of June. And, Khandelwal isn’t the only analyst who is highly rated by the Nobias algorithm that likes this company as a defensive dividend oriented play.
Nicholas Ward is a Senior Investment Analyst at Wide Moat Research. He has spent the last 8 years writing about the stock market at various publications, including Seeking Alpha, The Street, Forbes Real Estate Investor, Sure Dividend, The Dividend Kings, iREIT, Safe High Yield, and The Intelligent Dividend Investor.
in a recent Motley Fool article titled, “Before The Market Crash Comes, Buy and Hold These 3 Dividend Stocks” where various contributors picked their favorite defensive investments to hold throughout periods of market volatility, Daniel Foelber, a Nobias 5-star rated analyst, chose Chevron as his pick, saying, “Chevron is one of the rare energy Dividend Aristocrats. Despite booms and busts in the oil and gas market, it has been able to boost its annual payout for over 30 consecutive years. This consistency is due in part to the strength of its balance sheet, which continues to be arguably the best of the oil majors.”
Foelber mentioned CVX’s cyclical nature, noting, “For better or worse, Chevron stock tends to march to the beat of oil and gas prices rather than if the market is rising or falling.” However, he concluded his bullish pick by saying, “Given this operational advantage, a track record for strong financials, and consistent dividend raises, Chevron is an oil stock worth buying before a market crash.” Overall, 90% of the credible authors that the Nobias algorithm tracks have a “Bullish” outlook on CVX shares.
In the last month alone, we’ve seen 10 reports published on the stock by 4 and 5-star rated analysts. 9 of these reports came with “Buy” ratings and the remainder came with a “Neutral” outlook. Right now, the average price target amongst these highly rated individuals for Chevron is $124.40, which implies 22.2% upside potential relative to the stock’s current share price of $101.81.
Disclosure: Nicholas Ward has no position in any stock mentioned in this article. Nicholas Ward wrote this article for Nobias at their request with a view of giving investors a balanced perspective based on the writings of Nobias highly rated analysts and bloggers. Nobias has no business relationship with any company whose stock is mentioned in this article and does not have a position in this stock.
Additional disclosure: All content is published and provided as an information source for investors capable of making their own investment decisions. None of the information offered should be construed to be advice or a recommendation that any particular security, portfolio of securities, transaction, or investment strategy is suitable for any specific person. The information offered is impersonal and not tailored to the investment needs of any specific person.
Disclaimer: The Nobias star rating is based on past performance results and is not an indicator of future results. These past performance returns do not represent returns that any investor actually earned. Assumptions made include the ability to purchase the stocks recommended by the author under liquid markets where the transaction would be at the market price for the day. In reality, loss in liquidity may have a material impact on the returns that actually may have been earned. Further, returns are calculated without any including transaction costs, management fees, performance fees or expenses, or reinvestment of dividends and other income. This information is provided for illustrative purposes only.
Broadcom Inc: Upside Ahead, Even Without the SAS Acquisition
Sometimes, stocks are in the news for what turns out not to be any news at all. This recently happened to Broadcom (AVGO), when the Wall Street Journal reported that Broadcom was in talks to acquire SAS Institute, which is the largest privately held software services provider. In a recent article, Anusuya Lahiri, a Nobias 4-star rated analyst who writes for Bezinga, broke down the WSJ story, saying that AVGO appeared to be attempting to “double down on enterprise software”. Lahiri noted that “A deal, which would value SAS in the range of $15 billion- $20 billion, could be finalized in the coming weeks.” And, she stated that as of May 2, 2021, Broadcom held $9.5 billion of cash and cash equivalents, which meant that the company could easily make such a deal.
Often stocks are in the news for what turns out not to be any news at all. This recently happened to Broadcom (AVGO), when the Wall Street Journal reported that Broadcom was in talks to acquire SAS Institute, which is the largest privately held software services provider. In a recent article, Anusuya Lahiri, a Nobias 4-star rated analyst who writes for Bezinga, broke down the WSJ story, saying that AVGO appeared to be attempting to “double down on enterprise software”.
Lahiri noted that “A deal, which would value SAS in the range of $15 billion- $20 billion, could be finalized in the coming weeks.” And, she stated that as of May 2, 2021, Broadcom held $9.5 billion of cash and cash equivalents, which meant that the company could easily make such a deal.
AVGO shares jumped some 4% on this news when it broke in mid-July. The market obviously liked the idea of this chip maker continuing to diversify its revenue stream into the software-as-a-service (SaaS) industry because SaaS sales tend to result in higher margins, more predictable cash flows (oftentimes, SaaS sales are recurring and subscription based), and ultimately, higher multiples on earnings which results in higher share prices. However, after the WSJ report was published, it didn’t take long for SAS Institute's management team to squash the rumors. The very next day, another WSJ article was published saying that the deal was off.

Cara Lombardo authored that piece and she wrote, “Talks for Broadcom Inc. to buy SAS Institute Inc. have ended after the founders of the closely held software company changed their minds about a sale, people familiar with the matter said.” AVGO shares gave back their short-term gains in the days after this second report was published; however, over the course of the month of July, AVGO has continued to rise, apparently on its own accord. And, with that in mind, we wanted to take a look at what the credible authors that the Nobias algorithm tracks had to say about the stock’s prospects, even without the SAS acquisition in mind.
Nobias 5-star rated analyst, Nicholas Rossolillo recently published an article on Nasdaq.com titled, “3 Reasons Broadcom Is A Dirt Cheap Tech Dividend Stock”. The title here speaks for itself with regard to his bullish lean; however, he made it clear that in his opinion, the company can stand on its two feet just fine, even without increased exposure to software sales.
Rossolillo highlighted the strength of Broadcom’s semi-conductor business, saying, “During the fiscal 2021 second quarter (the three months ended May 2, 2021), total revenue increased 15% year over year to $6.61 billion. Driving this increase was a 20% rise in semiconductor sales, which make up about three-fourths of Broadcom's business.” He noted that AVGO’s chip segment has struggled a bit in recent years due to pressures put onto the company by the U.S./China trade war and then the COVID-19 pandemic, which created supply chain bottlenecks in the semiconductor industry.
However, he was quick to point out a demand turnaround, saying, “But now chips Broadcom specializes in are in high demand, especially for mobile phones (including for 5G mobility), data centers, business networking equipment, and automotive tech.”
Nicholas Ward is a Senior Investment Analyst at Wide Moat Research. He has spent the last 8 years writing about the stock market at various publications, including Seeking Alpha, The Street, Forbes Real Estate Investor, Sure Dividend, The Dividend Kings, iREIT, Safe High Yield, and The Intelligent Dividend Investor.
Rossolillo also highlighted the fact that AVGO has been busy in recent years in the merger and acquisition markets, acquiring other software oriented names such as CA Technologies, Symantec, and Brocade Communications. He said, “because of these acquisitions in the last few years, Broadcom's overall gross profit margin was 61% in fiscal Q2, compared to 56% a year ago and just 54% at the end of fiscal 2018.”
And, moving forward, Rossolillo remains bullish, noting that “Steady software growth paired with rallying chip sales means Broadcom's bottom-line will likely grow at an even faster rate for the remainder of this year.” And lastly, he touched upon the company’s strong cash flows, saying, “Broadcom reported a 28% increase in net income in Q2 to $2.98 billion and free cash flow of $3.44 billion. That equates to an incredible free cash flow profit margin of 52%.”
These cash flows have allowed AVGO to generously return cash to shareholders via a growing dividend. AVGO currently yields 2.97%, which is more than twice as high as the S&P 500’s 1.27% dividend yield. Right now, AVGO shares trade for 17.6x 2021 earnings-per-share expectations, which means that this company has a sub-market multiple. It appears that analysts believe this is a good deal, considering the stock is expected to grow its bottom-line at a 24% clip this year.
Ninety percent of the credible authors that we track with the Nobias algorithm have a “Bullish” rating on AVGO shares. Right now, the average credible analyst price target on AVGO is $526.63, which implies upside potential of approximately 8.5% when compared to the stock’s current share of of $485.40.
Disclosure: Nicholas Ward is long AVGO. Nicholas Ward wrote this article for Nobias at their request with a view of giving investors a balanced perspective based on the writings of Nobias highly rated analysts and bloggers. Nobias has no business relationship with any company whose stock is mentioned in this article and does not have a position in this stock.
Additional disclosure: All content is published and provided as an information source for investors capable of making their own investment decisions. None of the information offered should be construed to be advice or a recommendation that any particular security, portfolio of securities, transaction, or investment strategy is suitable for any specific person. The information offered is impersonal and not tailored to the investment needs of any specific person.
Disclaimer: The Nobias star rating is based on past performance results and is not an indicator of future results. These past performance returns do not represent returns that any investor actually earned. Assumptions made include the ability to purchase the stocks recommended by the author under liquid markets where the transaction would be at the market price for the day. In reality, loss in liquidity may have a material impact on the returns that actually may have been earned. Further, returns are calculated without any including transaction costs, management fees, performance fees or expenses, or reinvestment of dividends and other income. This information is provided for illustrative purposes only.
HCA: Up More Than 50% Year-to-Date, Does HCA Have More Upside Ahead?
The S&P 500 is having a great year thus far, up 17.29%. This is well above the major index’s long-term average and this strong double digit performance is something that the vast majority of investors are going to be incredibly pleased with. However, the 17.29% year-to-date performance pales in comparison to the 50.92% year-to-date performance that HCA Healthcare Inc. (HCA) has generated and with this in mind, we wanted to take a look at this hospital operator to see whether or not HCA shares have more room to run after the fantastic results that they’ve posted through the first 7 months of the year.
The S&P 500 is having a great year thus far, up 17.29%. This is well above the major index’s long-term average and this strong double digit performance is something that the vast majority of investors are going to be incredibly pleased with. However, the 17.29% year-to-date performance pales in comparison to the 50.92% year-to-date performance that HCA Healthcare Inc. (HCA) has generated and with this in mind, we wanted to take a look at this hospital operator to see whether or not HCA shares have more room to run after the fantastic results that they’ve posted through the first 7 months of the year.
HCA likely isn’t a stock that many investors have heard of. It certainly doesn’t carry the brand value of some of the big bio-tech/big-pharma stocks. However, this company is a major player in its field. Brenden Rearick, a Nobias 4-star rated analyst, highlighted the company’s size in a recent article, saying, “HCA is the largest health system in the U.S. by net patient revenue at over $44 billion; that’s nearly 50% greater than CommonSpirit Health, the second-largest system in the country.” He continued, noting that “HCA, which is based out of Nashville and operates across 2,000 facilities in both the U.S. and U.K.”.
Keith Speights, a Nobias 5-star rated analyst who publishes work at The Motley Fool, recently penned an article titled “3 Surprising Stocks That Have Crushed the Market so Far This Year” where he highlighted HCA’s 2021 gains. He began his HCA section by asking the all important question, “Why is the hospital chain having such a banner year?” Then, he quickly answered, “Chalk it up to a COVID-19 recovery.”

One might assume that hospitals would have thrived during a pandemic, but that wasn’t the case. Evan Niu, a Nobias 5-star rated analyst recently published an article at Millennial Money where he explained the weakness that hospital operators like HCA experienced last year saying, “One of the peculiar consequences of the COVID-19 pandemic was that many hospitals and other healthcare facilities took financial hits when the crisis started, as many patients avoided the facilities out of fear of exposing themselves to the deadly virus. People delayed many non-essential elective procedures—a major profit center for hospitals—out of an abundance of caution.”
Speights touched upon this as well saying, “Hospitals were hit hard last year during the worst of the pandemic. The biggest problem was that many more lucrative non-urgent surgeries had to be delayed. Those surgeries are no longer being pushed back, benefiting HCA.”
Niu highlighted HCA’s recent earnings result (which caused the stock to pop nearly 14%), saying, “Revenue in the second quarter came in at $14.4 billion, ahead of the consensus estimate of $13.6 billion. Same facility admissions jumped by 17.5%, while same-facility equivalent admissions were up 26.8%. The business is rebounding across the board as pandemic-related restrictions, which had previously been impacting demand and procedure volumes, have eased in recent months.”
Niu noted that HCA posted year-over-year growth in admissions, equivalent admissions, patient days, equivalent patient days, and outpatient surgery visits during Q2. He continued, saying, “That all resulted in net income of $1.45 billion, or $4.36 per share, easily beating the $3.16 per share in profit Wall Street was expecting. Adjusted EBITDA in the second quarter was $3.22 billion, including $822 million in government stimulus income.”
Nicholas Ward is a Senior Investment Analyst at Wide Moat Research. He has spent the last 8 years writing about the stock market at various publications, including Seeking Alpha, The Street, Forbes Real Estate Investor, Sure Dividend, The Dividend Kings, iREIT, Safe High Yield, and The Intelligent Dividend Investor.
Speights highlighted this growth in his article as well, mentioning that HCA management “expects demand will remain strong throughout the rest of 2021” which bodes well for the company’s bottom-line growth in a bounce-back year. Niu touched upon the company’s updated full-year guidance from the Q2 report, saying, “Thanks to the momentum HCA is seeing, the company boosted its full-year guidance. Revenue in 2021 is now forecast in the range of $57 billion to $58 billion, up from its prior outlook of $54 billion to $55.5 billion. This is the second consecutive quarter that HCA has increased its outlook after raising it in April. Adjusted EBITDA for 2021 should be $12.1 billion to $12.5 billion, which should result in earnings per share of $16.30 to $17.10. HCA Healthcare expects to spend approximately $3.7 billion in capital expenditures this year.”
With this increased guidance in mind, we’ve seen a handful of blue chip (4 and 5-star rated) analysts raise their price targets on HCA shares. Nobias 5-star rated Michael Wiederhorn of Oppenheimer placed a $275 price target on HCA. Nobias 4-star rated Ann Hynes of Mizuho followed suit with a $275 price target. Nobias 4-star rated Ralph Giacobbe of Citigroup updated his price target from $215 to $268. And, Nobias 4-star rated A.J. Rice of Credit Suisse came out with a $267 price target.
Overall, we see a recent average price target of $271.25 amongst the blue chip analyst group. This represents upside potential of approximately 9.2% when compared to HCA’s current share price of $248.20. Further, 81% of the credible authors that the Nobias algorithm tracks are “Bullish” on HCA shares. Right now, the average price target amongst the overall credible author community that we track is $272.50, representing upside potential of roughly 9.8%.
Disclosure: Nicholas Ward has no position in HCA. Nicholas Ward wrote this article for Nobias at their request with a view of giving investors a balanced perspective based on the writings of Nobias highly rated analysts and bloggers. Nobias has no business relationship with any company whose stock is mentioned in this article and does not have a position in this stock.
Additional disclosure: All content is published and provided as an information source for investors capable of making their own investment decisions. None of the information offered should be construed to be advice or a recommendation that any particular security, portfolio of securities, transaction, or investment strategy is suitable for any specific person. The information offered is impersonal and not tailored to the investment needs of any specific person.
Disclaimer: The Nobias star rating is based on past performance results and is not an indicator of future results. These past performance returns do not represent returns that any investor actually earned. Assumptions made include the ability to purchase the stocks recommended by the author under liquid markets where the transaction would be at the market price for the day. In reality, loss in liquidity may have a material impact on the returns that actually may have been earned. Further, returns are calculated without any including transaction costs, management fees, performance fees or expenses, or reinvestment of dividends and other income. This information is provided for illustrative purposes only.
IBM with Nobias technology: Is The Turnaround Finally Here?
International Business Machines (IBM) has been a perplexing stock for investors to follow over the last decade or so. “Big Blue” as the company is called, was a leader - potentially even the top dog - in the tech sector prior to the digital age. However, unlike many of its “old tech” peers, IBM has not been able to transition into the new growth sectors (cloud, digital security, artificial intelligence, software-as-a-service, etc) effectively.
It wasn’t long ago that IBM had gone more than 20 quarters in a row posting negative y/y growth. The company’s fall from grace was a long and arduous process, with its shareholders experiencing massive underperformance relative to its peers, the tech sector, and the broader markets at large.
IBM’s underperformance throughout the last decade has caused its valuation to crater to near single-digit price-to-earnings ratio levels. And now that IBM has generated positive top-line growth for two quarters in a row, investors are starting to ask themselves, “Has this format stalwart finally turned the corner?”

Cheap stocks are difficult to find in the tech sector and if IBM can sustain a positive growth rate moving forward, its shares could be a last bastion of hope for value investors. So, with all of this in mind, we wanted to take a look at what the credible analysts that the Nobias algorithm tracks have had to say about the stock during the past week in response to its positive Q2 earnings results.
When writing about what to expect in IBM’s Q2 results, Richard Saintvilus, a 5-star rated Nobias analyst, mentioned that IBM “has always been a great stock to buy for dividend investors. But has the company become more appealing to growth investors as well?” In his piece, he touched upon IBM’s lackluster performance in recent years saying, “Not only has the tech giant struggled to grow revenue over the past decade, IBM has been left out of the massive economic expansion that saw cloud leaders such as Amazon (AMZN) and Microsoft (MSFT) produce double-digit revenue gains.” “But,” he continues, “as the company transitions away from its legacy businesses, IBM’s turnaround has seemingly begun. Thanks to the Red Hat acquisition, which modernized its cloud business, IBM’s cloud ambitions have shown some promise in recent quarters.”
Saintvilus highlights IBM’s recent RedHat acquisition and the company’s fierce focus on the hybrid cloud market, where it hopes to compete for a large slice of the growing market share. With regard to the hybrid cloud space, Saintvilus writes, “according to Mordor Intelligence, the Hybrid Cloud Market — which was a $52 billion market in 2020 — is forecasted to reach $145 billion over the next five years, rising at a compound annual growth rates of almost 20%.”
So, if IBM is able to capture, maintain, or even grow market share in this industry, it could very well be the ticket for a return to growth and a much higher share price. Saintvilus concluded his piece saying that if IBM can continue its cloud improvements into the coming quarters, and accelerate its revenue growth to a double digit clip by the end of 2022, “IBM stock may finally recapture the $200 mark.”
Alan Farley, a Nobias 4-star rated analyst summed up IBM’s Q2 results concisely in the article that he published this week at Yahoo Finance saying, “International Business Machines Corp. (IBM) is trading higher by 3% in Tuesday’s pre-market after posting the strongest quarterly growth in three years. The old school tech behemoth reported a Q2 2021 profit of $2.33 per-share, $0.04 higher than estimates, while revenue rose a modest 3.4% year-over-year to $18.75 billion, $400 million higher than consensus. The company issued inline fiscal year guidance, expecting adjusted free cash flow of $11– $12 billion based in July exchange rates.”
During Q2 IBM saw RedHat’s revenues increase by 20%. Overall, the company’s cloud revenue posted strong gains as well and now, over the last 12 months, IBM’s cloud segment has posted 13% growth. This figure dwarf’s the company’s overall growth rate; however, after IBM spins off its legacy infrastructure business later this year and becomes a more cloud oriented company, it’s likely that we’ll see the new-IBM grow at a rate that is much closer to its cloud segment’s performance.
After these results, we’ve seen a handful of credible analysts increase their price targets on shares. For instance, this week we saw two highly rated Wall Street analysts, Keith Bachman of BMO Capital, who is rated 5-stars by the Nobias algorithm, and Katy Huberty of Morgan Stanley, who has a 4-star rating according to the Nobias algorithm, raised their price targets to $155 and $164, respectively. Overall, looking at the credible analysts that we track, we see an average price target of $159.00, which compared to IBM’s share price today of $141.34, implies upside potential of approximately 12.5%. And it’s interesting that the average price target is so high, because according to Farley, a rally into the mid-$150 level is what IBM needs to break out of its multi-year slump (from a technical perspective).
In his article, Farley wrote, “IBM topped out at 215.80 in 2013 and entered a brutal decline that posted an 11-year low in March 2020. The subsequent uptick reached an 8-year trendline of declining highs in June 2021, yielding a quick rally, followed by a failed breakout that reinforces the secular downtrend. A buying spike above 153 is now needed to mount this substantial barrier but that seems unlikely because the stock has been under active distribution for the last 18 months.” And, what is probably the most attractive aspect of IBM shares as a turnaround story is the company’s high dividend yield which implies that investors who buy shares today in hopes of future growth coming to fruition will likely be paid handsomely while they wait.
IBM’s current dividend yield is 4.66%. This is well above the roughly 1.3% yields that both the S&P 500 and the U.S. 10-year yield offer at the moment, making IBM a much more attractive relative asset for income oriented investors to focus on. Not only does IBM have a high yield, but the stock is a dividend aristocrat with a 26-year consecutive dividend increase streak. Although IBM’s annual increases have slowed as of late (as the company has struggled to produce sales/earning growth) many income oriented investors still rely on IBM for technology sector exposure. And after the Q2 results, Nicholas Rossolillo, a Nobias 5-star rated analyst who writes for The Motley Fool, highlighted IBM’s income oriented prowess in an article titled, “3 Reasons IBM Is A Top Dividend Stock After Reporting Q2 2021 Earnings.”
Nicholas Ward is a Senior Investment Analyst at Wide Moat Research. He has spent the last 8 years writing about the stock market at various publications, including Seeking Alpha, The Street, Forbes Real Estate Investor, Sure Dividend, The Dividend Kings, iREIT, Safe High Yield, and The Intelligent Dividend Investor.
Rossolillo began his piece highlighting the company’s “underrated” cloud sales. He points out that RedHat’s hybrid cloud sales growth is accelerating; in Q2 and Q3 2020, Redhat produced 17% growth, In Q4 2020 this rose to 19% growth, it dipped a bit in Q1 2021, back down to 17%, however, the 20% growth figure that Redhat posted in Q2 2021 is very bullish in his eyes. Then Rossolillo continued, pointing out the strong free cash flows that IBM geneates saying, “Through the first six months of the year, free cash flow was $2.56 billion, handily covering the $1.47 billion it paid out in shareholder dividends.” Finally, he mentions IBM’s improving balance sheet.
Rossolillo points out that “At the start of 2021, IBM had $61.5 billion in debt, so the old tech firm has reduced its liabilities to bondholders by some $6.3 billion so far this year -- and reduced debt by $17.9 billion since the purchase of Red Hat back in 2019.” All in all, he concludes, “Put another way, IBM's current dividend yield of 4.7% is a solid bet right now.” And, he isn’t the only one who thinks this. In a recent article, Martin Baccardax, who is a Nobias 4-star rated analyst who works at TheStreet.com, highlighted a tweet posted by noted CNBC analyst Jim Cramer shortly after IBM’s Q2 results were posted. Cramer said, “IBM beats top and bottom with strong Red Hat... and dividend safe . big f/c/f”.
Overall, the response to IBM’s Q2 has been very bullish. We’ve seen blue chip (4 and 5-star rated analysts) post 15 reports about the company since July 19th when the quarterly results were published and 10 of these articles came with “Buy” ratings attached. 77% of the credible analysts that Nobias tracks remain “Bullish” on IBM shares, which appears to point towards more upside ahead.
Disclosure: Nicholas Ward has no position in IBM. Nicholas Ward wrote this article for Nobias at their request with a view of giving investors a balanced perspective based on the writings of Nobias highly rated analysts and bloggers. Nobias has no business relationship with any company whose stock is mentioned in this article and does not have a position in this stock.
Additional disclosure: All content is published and provided as an information source for investors capable of making their own investment decisions. None of the information offered should be construed to be advice or a recommendation that any particular security, portfolio of securities, transaction, or investment strategy is suitable for any specific person. The information offered is impersonal and not tailored to the investment needs of any specific person.
Disclaimer: The Nobias star rating is based on past performance results and is not an indicator of future results. These past performance returns do not represent returns that any investor actually earned. Assumptions made include the ability to purchase the stocks recommended by the author under liquid markets where the transaction would be at the market price for the day. In reality, loss in liquidity may have a material impact on the returns that actually may have been earned. Further, returns are calculated without any including transaction costs, management fees, performance fees or expenses, or reinvestment of dividends and other income. This information is provided for illustrative purposes only.
Chipotle: Is This Stock Still Appetizing After its Q2 Rally?
Chipotle (CMG) has been one of the best performers in the entire market since the COVID-19 bottom. Today, CMG shares are trading for $1830.92, which means that they have more than quadrupled from their $415 lows at the depths of the COVID-19 sell-off in March of 2020. But, this isn’t just a bounce back play in the restaurant sector. Chipotle shares are up 29.7% year-to-date, meaning that they’ve essentially doubled the performance of the S&P 500. With this in mind, it’s clear that investors continue to believe in this company’s long-term growth prospects. Chipotle reported its second quarter earnings this week, which sent the stock rallying higher (CMG shares rose 13.69% this week alone). Therefore, we wanted to take a look at the credible authors tracked by the Nobias algorithm to see whether or not CMG is a “Buy” or a “Sell” after its most recent results.
Chipotle (CMG) has been one of the best performers in the entire market since the COVID-19 bottom. Today, CMG shares are trading for $1830.92, which means that they have more than quadrupled from their $415 lows at the depths of the COVID-19 sell-off in March of 2020. But, this isn’t just a bounce back play in the restaurant sector. Chipotle shares are up 29.7% year-to-date, meaning that they’ve essentially doubled the performance of the S&P 500. With this in mind, it’s clear that investors continue to believe in this company’s long-term growth prospects. Chipotle reported its second quarter earnings this week, which sent the stock rallying higher (CMG shares rose 13.69% this week alone). Therefore, we wanted to take a look at the credible authors tracked by the Nobias algorithm to see whether or not CMG is a “Buy” or a “Sell” after its most recent results.
With regard to Chipotle’s recent rally, Jeremy Bowman, a 4-star rated analyst who writes for The Motley Fool, recently took part in a podcast which discussed the company’s COVID-19 success, focused primarily on its digital transformation. His introduction to the podcast said it all; Bowman wrote, “After its sales initially sank at the start of the pandemic, Chipotle Mexican Grill (NYSE:CMG) turned out to be one of the biggest winners in the restaurant sector thanks to its ability to pivot to digital and delivery, the expansion of its drive-thru concept, Chipotlanes, and a rewards program that now has more than 21 million members.”
Dan Caplinger, one of Bowman’s colleagues at The Motley Fool and a Nobias 4-star rated analyst, published a piece more recently, highlighting CMG’s Q2 results. Regarding the company’s operations, Caplinger wrote, “Chipotle's gains came after strong second-quarter earnings results. The fast-casual chain saw revenue soar 39% from the year-ago quarter, as comparable restaurant sales climbed 31.2%. Chipotle's earnings performance was even more impressive, with adjusted figures of $7.46 per share representing a more than 18-fold jump year over year.” Caplinger continued, touching upon the success of CMG’s digital sales, noting that they were up double digits on a year-over-year basis, and brought up the company’s growth potential, saying, “Looking ahead, Chipotle expects full-year comparable restaurant sales growth in the low to mid-double-digit percentage range, with 200 or more new restaurant openings. Restaurants are coming back, and Chipotle looks like it's poised to get back to its winning ways.”

Coming into the quarter, expectations for the company’s growth were high. One could argue that the stock was priced to perfection coming into the Q2 print, which tends to lead towards downside once the results are actually posted due to the difficulty of meeting such high expectations. However, it appears that CMG did just that.
On July 4th, Neil Patel, a Nobias 4-star rated analyst, published an article on The Motley Fool, which highlighted the growth potential laid out by CMG’s CEO Brian Niccol at a recent Piper Sandler Investor Conference. Regarding the company’s 2021 growth acceleration, Patel wrote, “Niccol mentioned Chipotle is now "going to start talking about $3 million, $3.5 million AUVs (annual unit volumes)." This is up meaningfully from a previous AUV target of $2.5 million, which he highlighted as recently as the first-quarter 2021 earnings call in April.” And, Patel continued, the company’s digital growth (online orders via the Chipotle App) are an even stronger tailwind for the company. He said, “In each of the last four quarters, sales via digital channels more than doubled with the second and third quarters of 2020 growing in excess of 200%. Chipotle now counts 21 million rewards members, quite the accomplishment given the program was launched just over two years ago.”
Patel believes that the digital growth is not likely to hamper in-store orders either, noting “This thinking certainly supports the rosy sales outlook, as only an estimated 10% to 15% of customers actually both dine in and order online. “ Patel also highlighted CMG’s international expansion as a potential catalyst to drive share prices higher. He touched upon Niccol’s comments regarding expansion into non-U.S. markets, saying, ‘There are currently 24 locations in Canada, but there's potential for a "few hundred." Furthermore, expansion into Europe (Chipotle has 11 stores in the U.K. today) could drive unit growth as well.” But, even with all of this potential in play, Patel also made it clear when making investments, “valuation matters.”
It’s clear that CMG trades with a lofty valuation today. The stock is currently trading for approximately 70.5x 2021 consensus earnings-per-share expectations, which puts Chipotle firmly into the speculative growth category (this multiple is more than 3x higher than the ~21x forward price-to-earnings multiple that the S&P 500 trades with). And, to conclude his piece, Patel attempts to break down the future potential of the company from sales, operating income, and earnings-per-share perspective, to highlight its total return potential for investors purchasing shares at today’s prices. Patel attempts to look out 10 years to 2031 by looking at store expansion prospects and store profitability metrics. He says, “Even if the company has 6,000 locations (reiterated by Niccol as a long-term goal on the earnings call) in 10 years, which equates to 320 openings per year, annual revenue in 2031 would total about $21 billion.”
Patel continues, noting that prior to the E.coli outbreak in 2015, CMG’s profit margins hovered around 10%. But, he notes, “it has since fallen due to higher food and safety costs.” For the sake of this bullish scenario, he projects 12% margins, due to “greater volume and subsequent operating leverage” which, alongside store expansion, would result in annual earnings of approximately $2.5b in 2031.
Nicholas Ward is a Senior Investment Analyst at Wide Moat Research. He has spent the last 8 years writing about the stock market at various publications, including Seeking Alpha, The Street, Forbes Real Estate Investor, Sure Dividend, The Dividend Kings, iREIT, Safe High Yield, and The Intelligent Dividend Investor.
Moving to valuation, he says, “In 10 years' time, let's say the stock carries a forward earnings multiple of 38. This is what Starbucks, at this point a mature food and beverage giant, trades at as of this writing. This would result in a modest compound annual return of just 8% over the next decade. And remember, this is in a best-case scenario where Chipotle opens more stores per year than it ever has and achieves a profit margin it never has before.” With this in mind, he concludes his article saying, “For outside investors wanting to get in on this fast-casual leader, it's best to wait for a meaningful pullback before you even think of purchasing shares.”
Overall, Patel seems to be more cautious than most on CMG’s future. Looking at the 4 and 5-star rated analyst who’ve published articles on Chipotle during the last month, we see 20 “Buy” opinions posted as opposed to just 3 “Sell” ratings. In fact, 80% of the credit authors that we track are “Bullish” on CMG shares.
The average price target on CMG provided by these credible authors is 1832.63 however, which only points towards minimal upside. But, it’s important to note that many analysts have yet to update their evaluation models since the Q2 results. We’ve seen 5 5-star rated analysts update their price targets on CMG shares since the recent Q2 report and the average updated price target there was $1921, which implies upside potential of 4.9%.
Disclosure: Nicholas Ward has no CMG position. Nicholas Ward wrote this article for Nobias at their request with a view of giving investors a balanced perspective based on the writings of Nobias highly rated analysts and bloggers. Nobias has no business relationship with any company whose stock is mentioned in this article and does not have a position in this stock.
Additional disclosure: All content is published and provided as an information source for investors capable of making their own investment decisions. None of the information offered should be construed to be advice or a recommendation that any particular security, portfolio of securities, transaction, or investment strategy is suitable for any specific person. The information offered is impersonal and not tailored to the investment needs of any specific person.
Disclaimer: The Nobias star rating is based on past performance results and is not an indicator of future results. These past performance returns do not represent returns that any investor actually earned. Assumptions made include the ability to purchase the stocks recommended by the author under liquid markets where the transaction would be at the market price for the day. In reality, loss in liquidity may have a material impact on the returns that actually may have been earned. Further, returns are calculated without any including transaction costs, management fees, performance fees or expenses, or reinvestment of dividends and other income. This information is provided for illustrative purposes only.
PepsiCo Beats Expectations and Raises Guidance In Its Q2 Report
PepsiCo (PEP) was in the spotlight this week with the company posting its second quarter earnings. Coming into the earnings report, PEP shares had underperformed the S&P 500 by a fairly wide margin throughout 2021, posting low-single digit year-to-date gains compared to the broader market’s roughly 15% appreciation. However, in recent weeks, we’ve seen investor sentiment shift a bit, with regard to mature, defensive, consumer staples stocks like PepsiCo, in large part due to the falling yield on the U.S. 10-year treasury notes and investor demand for passive income in a yield starved market.
PepsiCo (PEP) was in the spotlight this week with the company posting its second quarter earnings. Coming into the earnings report, PEP shares had underperformed the S&P 500 by a fairly wide margin throughout 2021, posting low-single digit year-to-date gains compared to the broader market’s roughly 15% appreciation. However, in recent weeks, we’ve seen investor sentiment shift a bit, with regard to mature, defensive, consumer staples stocks like PepsiCo, in large part due to the falling yield on the U.S. 10-year treasury notes and investor demand for passive income in a yield starved market.
PepsiCo is well known for its dividend, having posted 49 years of consecutive dividend growth. And, while no equity dividend is ever completely safe and comparisons between dividend yields and bond yields are an apples to oranges comparison, in terms of safety, the fact is, a dividend increase streak that spans nearly 5 decades is going to provide a sense of solace for someone looking to put capital to work.
With bullish sentiment surrounding shares, the company had a lot at stake when it came to its quarterly report. Because of this, we wanted to take a look at the reports published this week by the credible authors that the Nobias algorithm tracks to see whether or not the recent rally that PEP shares have experienced is something that investors should consider buying into or avoid in today’s marketplace.

Richard Saintvilus, a Nobias 5-star rated analyst published an article on July 12th (the day before PepsiCo’s Q2 report) highlighting his expectations for the quarter. He noted Pepsi’s share price weakness as of late, mentioning the disappointing year-to-date performance as well as the fact that PEP shares had only risen “13% over the past year, compared to the 38% rise in the S&P 500”. However, Saintvilus points out that PepsiCo has “underperformed despite reporting not only rapid organic sales growth, but also strong free cash flow in 2020 amid the pandemic.”
In other words, while sentiment surrounding shares has been negative over the last year or so, the company’s fundamentals continue to improve. He chalks a lot of this up PEP’s diversified portfolio, which sets PepsiCo apart from its peers in the soda aisle (Saintvilus mentions that Coca-Cola (KO) and Keurig Dr. Pepper (KDP) are pure play beverage names whereas PepsiCo has exposure to snack foods as well via brand names like Quaker Foods, Rice-A-Roni, and Frito-Lay). He said, “Pepsi’s Frito-Lay brands snack business has taken off as shoppers stocked both their pantries and refrigerators. What’s more, as people work and learn from home, the company has benefited from increased at-home breakfast, snacking and dinner trends.” And, in the beverage space, Saintvilus highlight’s recent success that PepsiCo has had, noting that the company “has gained market share in several key categories. Not only has the company grown in share in total juices and juice drinks, Pepsi has also taken share in sparkling water categories, as well as ready-to-drink tea and coffee beverages.”
Coming into the Q2 print, Saintvilus said that Wall Street expects the company to generate earnings-per-share of $1.53 per share on revenue of $17.97 billion. And, on the 13th, PepsiCo management did not disappoint. When the actual earnings were posted, we saw GAAP earnings-per-share of $1.70 and non-GAAP earnings-per-share of $1.72. These two figures beat the analyst expectations by $0.18/share and $0.19/share, respectively.
The year-over-year earnings growth rate came in at 44% during Q2 and on the top-line, PEP’s performance was nearly as impressive, with revenues of $19.22 billion, which represented 20.5% year-over-year growth and beat analyst estimates by $1.27 billion. Mark Vickery, a Nobias 4-star rated analyst, published a report associated with PEP’s Q2 numbers on Yahoo Finance this week. In his note, Vickery put a spotlight on the top and bottom line beats, as well as saying, “Organic Revenue Growth of +7.4% was very strong, and guidance is for +6% organic revenue growth through the second half of 2021.” Really, this strong performance shouldn’t have come as a surprise to anyone. Vickery concluded his piece saying, “PepsiCo has not missed an earnings estimate since Q4… of 2009!”
Dan Caplinger, a Nobias 4-star rated analyst, published a post-earnings article at The Motley Fool this week, and in his piece, Caplinger highlighted some of the specific segment results saying, “Looking more closely at various PepsiCo segments, the various beverage units showed substantial gains in revenue and volume, led by a 34% rise in volume in PepsiCo's Africa, Middle East, and South Asia unit and a 21% rise in organic revenue at PepsiCo Beverages North America.”
Caplinger did note that “Snack foods performed less well, though, with Quaker Foods North America reporting a 14% decline in organic revenue as sales volumes dropped 21% year over year.” Some of this is being attributed to different shopping habits (a year ago during the pandemic, consumers were hoarding non-perishable goods like the snacks that PepsiCo sells) and overall, the guidance that management provided for the rest of the year was also impressive. Caplinger concluded his article saying, “PepsiCo sees growth continuing, and it now expects full-year earnings to rise 11% after having previously seen single-digit percentage growth as being likely. Many see PepsiCo as a stalwart stock, and it's certainly done a good job over the long run keeping its business strong.”
In a post-earnings CNBC Interview, Hugh Johnston, who serves as Vice Chairman and CFO at PepsiCo, was obviously pleased with the results saying, “We feel awfully good about the way the business is performing right now.” Johnson also highlighted Saintvilus’s point about market share gains, saying that PepsiCo is taking share from smaller beverage players, as well as “the biggest competitor down in Atlanta”, referring to rival Coca-Cola.
Nicholas Ward is a Senior Investment Analyst at Wide Moat Research. He has spent the last 8 years writing about the stock market at various publications, including Seeking Alpha, The Street, Forbes Real Estate Investor, Sure Dividend, The Dividend Kings, iREIT, Safe High Yield, and The Intelligent Dividend Investor.
In PepsiCo’s Q2 report, the company’s CEO, Ramon Laguarta also had positive things to say. After provided the bullish guidance that Caplinger touched upon above, Laguarta said, “Our results give us confidence that the investments behind our Faster, Stronger and Better framework are working - as we invest in our brands, supply chain and go-to market systems, manufacturing capacity, capabilities and culture, and our society by integrating purpose into everything we do. Moving forward, we remain focused on winning in the marketplace and building competitive advantages that will position us well as consumer habits and preferences evolve over time.”
Because of the strong results, PepsiCo shares were up more than 4.2% this week. This pushes their year-to-date gains up above 5%; however, this means that the stock still has come catching up to do with regard to its performance relative to the S&P 500’s. Yet, it seems that PEP still has upside ahead because when we look at the community of credible authors that the Nobias algorithm tracks, we see that 89% of writers are bullish.
This week alone we saw 4 and 5-star authors publish 12 reports on Pepsico shares. One of these reports was Neutral, 2 of them were bearish, and the other 9 were bullish. And, these 4 and 5-star rated analysts have an average price target of $161.50 on PEP shares, which implies upside potential of 3.6% compared to PEP’s current share price of $155.82.
Disclosure: Nicholas Ward is long KO and PEP. Nicholas Ward wrote this article for Nobias at their request with a view of giving investors a balanced perspective based on the writings of Nobias highly rated analysts and bloggers. Nobias has no business relationship with any company whose stock is mentioned in this article and does not have a position in this stock.
Additional disclosure: All content is published and provided as an information source for investors capable of making their own investment decisions. None of the information offered should be construed to be advice or a recommendation that any particular security, portfolio of securities, transaction, or investment strategy is suitable for any specific person. The information offered is impersonal and not tailored to the investment needs of any specific person.
Disclaimer: The Nobias star rating is based on past performance results and is not an indicator of future results. These past performance returns do not represent returns that any investor actually earned. Assumptions made include the ability to purchase the stocks recommended by the author under liquid markets where the transaction would be at the market price for the day. In reality, loss in liquidity may have a material impact on the returns that actually may have been earned. Further, returns are calculated without any including transaction costs, management fees, performance fees or expenses, or reinvestment of dividends and other income. This information is provided for illustrative purposes only.
BAC with Nobias Technology: Can Bank of America Continue its Strong 2021 Rally?
After being unloved for the better part of a decade (due to their poor performance during the Great Recession period) big bank stocks have come to the forefront of the market in 2021, generating some of the best year-to-date returns within the S&P 500. This week, Bank of America (BAC) posted its second quarter earnings and several of the highly rated analysts that we track with the Nobias algorithm came out with reports on the news. Therefore, we wanted to highlight their opinions on the stock’s recent report to see whether or not the outperformance that BAC shares have generated throughout 2021 thus far is likely to remain in place.
Although Bank of America got off to a hot start in 2021, rising some 36% during the first six months of the year, BAC shares have experienced a bit of a dip over the last month or two, falling approximately 12.8% from their recent 52-week highs, as the story associated with rising rates has lost its steam.
However, Bram Berkowitz, a Nobias 4-star rated analyst who writes for The Motley Fool, recently published an article highlighting the company’s 2021 strength and discussing why it is that he continues to believe that the bank is a solid potential long-term investment. Berkowitz began his piece saying, “Shares of America's second-largest bank by assets had a tremendous first half of the year as the economy reopened and began to recover from the unprecedented coronavirus pandemic in 2020. The big story for Bank of America was strong credit quality, strong performance in its non-lending businesses, and a promising outlook for loan growth and future rate hikes.”
Berkowitz noted that the 2020 pandemic could have been catastrophic for big banks like Bank of America; however, the Federal Reserve acted quickly in the face of the pandemic threat, dropping its federal funds rate to zero and flooded the economy with liquidity which stopped BAC from experiencing unexpected loan losses. He wrote, “However, thanks to trillions of dollars in government stimulus and other interventions from the Federal Reserve and federal government, the billions in losses that banks expected never materialized. In the first quarter of this year, Bank of America released $2.7 billion of reserves previously built up for loan losses back into earnings.”

The dovish policies by the Fed during the pandemic plus the idea that rates are headed higher in the short-term (during 2021, they’ve risen from ~0.91% to ~$1.30% thus far) creates a scenario that is bullish for banks. Rising rates is an easy way to predict higher earnings for big money center banks like BAC because of the net interest income that it should help them to produce. However, Berkowitz points out that much of this bullish sentiment is already priced into stocks. He writes, “Bank of America's stock is now trading as high as it has since the Great Recession, and higher than where the bank traded before the pandemic. The bank also now trades at a very high valuation of 191% of tangible book value (equity minus intangible assets and goodwill).”
Berkowitz concludes his article writing, “But while the valuation is high, I still really like how Bank of America is positioned long-term.” He says that BAC weathered the pandemic well and continues to have “strong credit quality” and a “very sturdy balance sheet”. And, in the event that rates do move higher, BAC is likely to be a major beneficiary.
All in all, he says, “Some of this is surely priced in, but it's hard to look at Bank of America right now and not see a tremendous banking business well positioned for the future.” And, Berkowitz isn’t the only blue chip rated (4 or 5-star) author that publishes content at the Motley Fool who is very bullish on BAC shares.
In a recent Motley Fool podcast, Nobias 5-star rated analyst, Matt Frankel discussed Bank of America in a very bullish light, explaining why it’s his largest personal holding. Matt Frankel said, “Bank of America CEO Brian Moynihan just put out a report this morning or he said this morning that consumer spending is up by 20%, not over last year, but over June 2019, pre-pandemic levels. So 20% over pre-pandemic levels and that's across credit cards, debit cards, and the Zelle money transfer platform.” And, he noted that travel expenses are still down 15% from pre-pandemic levels, but he sees those numbers improving as well. He noted the pent up demand to get out of the house after the social distancing related to the COVID pandemic, saying that after 2020, “We have a newfound appreciation for being able to do things, and this could be a really big trend for the banking sector [referring to travel and leisure].”
How does this relate to Bank of America? Well, Frankel notes, “Banks make their money primarily by lending money and earning interest. Bank of America, in particular, has a very high proportion of non-interest-bearing deposits. Almost 40% of their entire deposit base, they don't pay their depositors interest on. That's a pretty big number. It's over $700 billion of deposits are non-interest-bearing at Bank of America. That means as the economy heats up, as people are spending money, that should lead to rising interest rates.”
With regard to a spending increase, he says, “That's a when not an if.” And, Franklel confused his bullish out BAC shares saying, “I think Bank of America could be one of the biggest beneficiaries of the reopening for several years to come.” Then, he doubled down on this bullish stance, highlighting not only the potential benefit of increased spending activity across the consumer economy, but also the fact that unlike many stocks in today’s market, Bank of America appears to be immune to threats associated with rising inflation. He makes his final point, exclaiming, “It's one of the few stocks even on this list that doesn't have that much to worry about from inflation. Inflation is a good thing from the bank's perspective. I'm a big fan of Bank of America. It's the biggest bank holding in my portfolio, it's the biggest bank holding in Warren Buffett's portfolio…” In other words, Frankel feels very confident about this position, essentially putting his money where his mouth is.
So, do the Bank’s fundamental results back up this bullish sentiment? Bank of America posted its Q1 earnings this week, with mixed results. The bank beat Wall Street estimates on the bottom-line, with GAAP earnings-per-share coming ni at $1.03/share, which was $0.26/share above expectations. However, BAC’s $21.47 billion in revenue was a bit disappointing, missing analyst estimates by $300 million and representing -3.7% year-over-year growth.
Net interest income was down 6% during the quarter, due primarily to lower interest rates that we saw during the same period a year ago. However, the company’s management was much more forward looking, with CEO Brian Moynihan, Chairman and CEO echoing the data expressed by Frankel above, saying, "Consumer spending has significantly surpassed pre pandemic levels, deposit growth is strong, and loan levels have begun to grow.”
Bank of America’s CFO says “At the same time, our balance sheet remains a source of strength, as supported by our performance in the most recent stress tests, which showed significant excess capital. We returned nearly $6 billion this quarter in common dividends and share repurchases and we expect to return a higher amount in the coming quarters, while we continue to deliver for our clients and the communities that we are so fortunate to serve." Back in April, Bank of America announced a $25 billion share buyback program, which should help the company to continue to grow its bottom-line. And, as Nobias 4-star rated analyst, Liz Kiesche, who serves as a Seeking Alpha news editor, pointed out recently, after passing the Federal Reserve's quality screens, Bank of America also plans to increase its dividend by 17%, starting with the Q3 payments.
Nicholas Ward is a Senior Investment Analyst at Wide Moat Research. He has spent the last 8 years writing about the stock market at various publications, including Seeking Alpha, The Street, Forbes Real Estate Investor, Sure Dividend, The Dividend Kings, iREIT, Safe High Yield, and The Intelligent Dividend Investor.
These increased shareholder returns point towards a bullish outlook by management with regard to cash flow generation and with that in mind, it should come as no surprise that the vast majority of credit analysts that Nobias tracks are bullish on shares. In short, it appears that investors are going to have to wait and see what the macro economy does (big banks are notoriously economically sensitive) with regard to BAC’s second half performance. Assuming that rates head higher (as most analysts seem to believe) then the bank’s bottom-line will likely continue to grow. But, as Berkowitz points out, the stock is expensive, so this growth must occur to justify the elevated multiples.
Right now, 83% of the credible authors that our algorithm tracks have established bullish positions on BAC shares. However, over the last month, after BAC’s big rally to start the year, we’re seeing more balanced opinions being posted. Since June, we’ve tracked 12 analyst reports posted by 4 and 5-star rated authors and they’re split down the middle in terms of buy and sell ratings. We saw 5 “Buy” ratings, 2 “Neutral” ratings, and 5 “Sell” ratings. With that in mind, it appears that BAC is a bit of a battle ground stock due to its elevated valuation and the uncertainties facing the broader economy.
Right now, the average price target provided by the blue chip analysts that we track for BAC is currently $39.50, which means that even after the stock’s strong 25% year-to-date gains (which beats the S&P 500’s 15% year-to-date gains by a significant margin), the stock appears to have upside potential of 4.1% (relative to its current share price of $37.92).
Disclosure: NIcholas Ward has no position in BAC. Nicholas Ward wrote this article for Nobias at their request with a view of giving investors a balanced perspective based on the writings of Nobias highly rated analysts and bloggers. Nobias has no business relationship with any company whose stock is mentioned in this article and does not have a position in this stock.
Additional disclosure: All content is published and provided as an information source for investors capable of making their own investment decisions. None of the information offered should be construed to be advice or a recommendation that any particular security, portfolio of securities, transaction, or investment strategy is suitable for any specific person. The information offered is impersonal and not tailored to the investment needs of any specific person.
Disclaimer: The Nobias star rating is based on past performance results and is not an indicator of future results. These past performance returns do not represent returns that any investor actually earned. Assumptions made include the ability to purchase the stocks recommended by the author under liquid markets where the transaction would be at the market price for the day. In reality, loss in liquidity may have a material impact on the returns that actually may have been earned. Further, returns are calculated without any including transaction costs, management fees, performance fees or expenses, or reinvestment of dividends and other income. This information is provided for illustrative purposes only.
Lowe’s with Nobias Machine Learning: Should Investors Buy The Recent Dip?
Few companies in the world have benefitted from the COVID-19 pandemic more than Lowe’s (LOW). I have to admit, writing that sentence seemed odd...you’d think that during a global pandemic, the big winners would be in the healthcare space, right? Well, it turns out that from an earnings growth standpoint, very few companies (especially in the large cap space) performed better than Lowe’s over the last 18 months or so. The social distancing regulations put into place throughout the U.S. during 2020 and the stay-at-home/from-from-home trends that developed because of them turned out to be a major boon for Lowe’s operations.
During Lowe’s prior fiscal year, the company posted 24.2% revenue growth. And, more impressively, during fiscal 2021, Lowe’s generated earnings-per-share growth of 55%. Last year, the company’s omni-channel approach to sales really took off with Lowes.com posting 111% year-over-year sales growth. During its most recent fiscal year, Lowe’s generated $9.3 billion in free cash flow and returned $6.7 billion to its shareholders via dividends and buybacks.
In a recent article, Nobias 4-star rated analyst, Eric Volkman, who writes for The Motley Fool, touched upon these strong cash flows, saying, “Best of all for dividend devotees, free cash flow more than tripled to nearly $9.3 billion, providing that much more space for shareholder payouts.” While many companies were cutting their dividends, LOW announced a 9.1% dividend increase during August of 2020. Then, less than a year later, in May of 2021, the company announced that it was increasing its dividend by another 33.3%.

Jason Fieber, a Nobias 5-star rated analyst who publishes reports on Dailytradealert.com, recently covered the stock, writing an article with a specific focus on the company’s dividend growth. Referring to Lowe’s, He said, “This stock is a king among Aristocrats – it’s been increasing its dividend for 59 consecutive years. That time frame spans wars, recessions, terrorist attacks, and even a recent pandemic. But Lowe’s kept on pumping out their growing dividend. That’s the kind of resiliency you want in your investments.”
In December of 2020, Lowe’s announced that its board of directors had authorized a $15 billion share buyback program as well. This added to the existing $4.7 billion buyback authorization that the company had in place, pushing its buyback potential up to nearly $20 billion. And, the strong fundamental growth that LOW shares delivered during the pandemic period aren’t expected to end in the near-term. The housing market remains very hot. Interest rates remain low, yet commodity inflation and a lack of skilled workers in the construction space has resulted in a supply shortage in the housing space. The increased demand, alongside higher than average savings rates created by government stimulus programs, has inspired builders and DIY homeowners alike to embark upon construction/renovation projects that continue to drive Lowe’s sales.
In his article, Volkman wrote,“Even with the pandemic now waning throughout the U.S., that home improvement/new home buying push doesn't seem to be fading away. As a result, Lowe's is sticking to the guidance it offered last December, in which it forecast 22% year-over-year growth in total sales for 2021, despite an anticipated drop in per-share net profit to $7.53 to $7.63 (2020 result: $7.77). It remains a compelling investment.” This net profit figure that Volkman is referring to is the GAAP figure associated with LOW shares. On a non-GAAP basis, the consensus earnings-per-share estimate that Wall Street analysts have for LOW right now in the company’s current fiscal year is $11.03/share.
If Lowe’s is able to meet analyst expectations, this $11/share earnings figure wil represent 24% year-over-year growth. 24% growth on top of a 55% growth year means that during a period of just 2 years, LOW is expected to nearly double its bottom-line results (from $5.72 in fiscal 2020 to $11.03 in fiscal 2022). And, while this level of growth is abnormally high for the company, driven, in large part, by the unique social circumstances created by the COVID-19 pandemic, the company’s growth trajectory remains on a very steep upwards slope.
LOW recently reported Q1 earnings, which Value Investing News, a Nobias 5-star rated analyst, covered at valueinvestingnews.com. Breaking down the earnings report, the analysts said, “Lowe's Cos' revenue increased 27 percent over the past trailing twelve-month period versus the previous twelve-month period. Gross margins increased to 34.01% for the first quarter compared to the same period in the previous year, and operating margins increased to 13.29% over the same period. Net earnings for past trailing twelve months were $6790.0 million, up 49% from the prior year.”
Value Investing News continued, writing, “Moving on to the balance sheet, Lowe's Cos' cash levels jumped 12% for the first quarter over the same period last year. Overall liquidity of the balance sheet, as measured by the current ratio, decreased 2.1% this past year. The current ratio for Lowe's Cos now stands at 1.17. The company decreased shares outstanding by 5.3%.”
Nicholas Ward is a Senior Investment Analyst at Wide Moat Research. He has spent the last 8 years writing about the stock market at various publications, including Seeking Alpha, The Street, Forbes Real Estate Investor, Sure Dividend, The Dividend Kings, iREIT, Safe High Yield, and The Intelligent Dividend Investor.
Lowe’s beat Wall Street’s estimates on both the top and bottom lines during its recent Q1 report, which marked the 5th consecutive quarter that the company achieved that feat. LOW shares have become known for generating reliable double digit growth, in terms of both earnings-per-share and total returns, in the short-term. However, looking at the stock through a longer-term lens, Fieber shows that LOW has been treating its shareholders very well for decades.
In his bullish article, Fieber highlighted the long-term shareholder returns that LOW shares have generated saying, “So if you had invested only $5,000 into Lowe’s in 1991 – that’s 30 years ago – that $5,000 would have compounded at an annual rate of 24.1% and turned that single $5,000 investment into more than $3 million.” Right now, the average price target provided by 4 and 5-star rated analysts tracked by our algorithm for LOW is $230.17/share.
Today, LOW shares trade for $195.75, having fallen more than 8.2% from their 52-week highs set back in May. With Lowe’s historical performance in mind, combined with the recent dip that we’ve witnessed, we weren’t surprised to see that 88% of Nobias-rated credible authors have a bullish outlook on shares. Looking at the average price target provided by the blue chip analysts that we track, it appears that this dip has created an attractive buying opportunity. That $230.17/share price target implies 17.6% upside potential. And, that doesn’t include Lowe’s 1.64% dividend yield. With the dividend in mind, it appears that LOW has upside potential of nearly 20%.
Disclosure: Nicholas Ward is long LOW shares. Nicholas Ward wrote this article for Nobias at their request with a view of giving investors a balanced perspective based on the writings of Nobias highly rated analysts and bloggers. Nobias has no business relationship with any company whose stock is mentioned in this article and does not have a position in this stock.
Additional disclosure: All content is published and provided as an information source for investors capable of making their own investment decisions. None of the information offered should be construed to be advice or a recommendation that any particular security, portfolio of securities, transaction, or investment strategy is suitable for any specific person. The information offered is impersonal and not tailored to the investment needs of any specific person.
Disclaimer: The Nobias star rating is based on past performance results and is not an indicator of future results. These past performance returns do not represent returns that any investor actually earned. Assumptions made include the ability to purchase the stocks recommended by the author under liquid markets where the transaction would be at the market price for the day. In reality, loss in liquidity may have a material impact on the returns that actually may have been earned. Further, returns are calculated without any including transaction costs, management fees, performance fees or expenses, or reinvestment of dividends and other income. This information is provided for illustrative purposes only.
Bed Bath & Beyond with Nobias Machine Learning: Is This ‘Meme’ Stock’s Turnaround The Real Deal?
Bed Bath & Beyond recently posted its first quarter results, which sent it stock soaring by approximately 20%. Unfortunately for the bulls, that pop was short-lived, with investors later selling shares as they digested the company’s results and listened to management’s growth plans during the conference call. BBBY shares are up nearly 8.2% during the last week; however, that rally still leaves the stock down nearly 30% from its highs posted one month ago. Showing the extent of BBBY’s 2021 volatility, we see that even down 30% during the last 30 days, Bed Bath & Beyond shares are up more than 76% on a year-to-date basis. Simply put, this stock has provided investors with a wild ride. And, with that being said, we wanted to take a look at what the blue chip analysts (4 and 5-star rated) tracked by the Nobias algorithm have had to say about the stock recently.
Bed Bath & Beyond recently posted its first quarter results, which sent it stock soaring by approximately 20%. Unfortunately for the bulls, that pop was short-lived, with investors later selling shares as they digested the company’s results and listened to management’s growth plans during the conference call. BBBY shares are up nearly 8.2% during the last week; however, that rally still leaves the stock down nearly 30% from its highs posted one month ago. Showing the extent of BBBY’s 2021 volatility, we see that even down 30% during the last 30 days, Bed Bath & Beyond shares are up more than 76% on a year-to-date basis. Simply put, this stock has provided investors with a wild ride. And, with that being said, we wanted to take a look at what the blue chip analysts (4 and 5-star rated) tracked by the Nobias algorithm have had to say about the stock recently.
Throughout 2021, much of BBBY’s volatility has come from its relatively high short interest (right now, nearly 21% of the company’s shares are sold short, due to its poor performance, especially relative to peers in the retail space) and the “meme stock” rallies that have occurred with retail investors attacking shorts and attempting to inspire massive short squeezes.
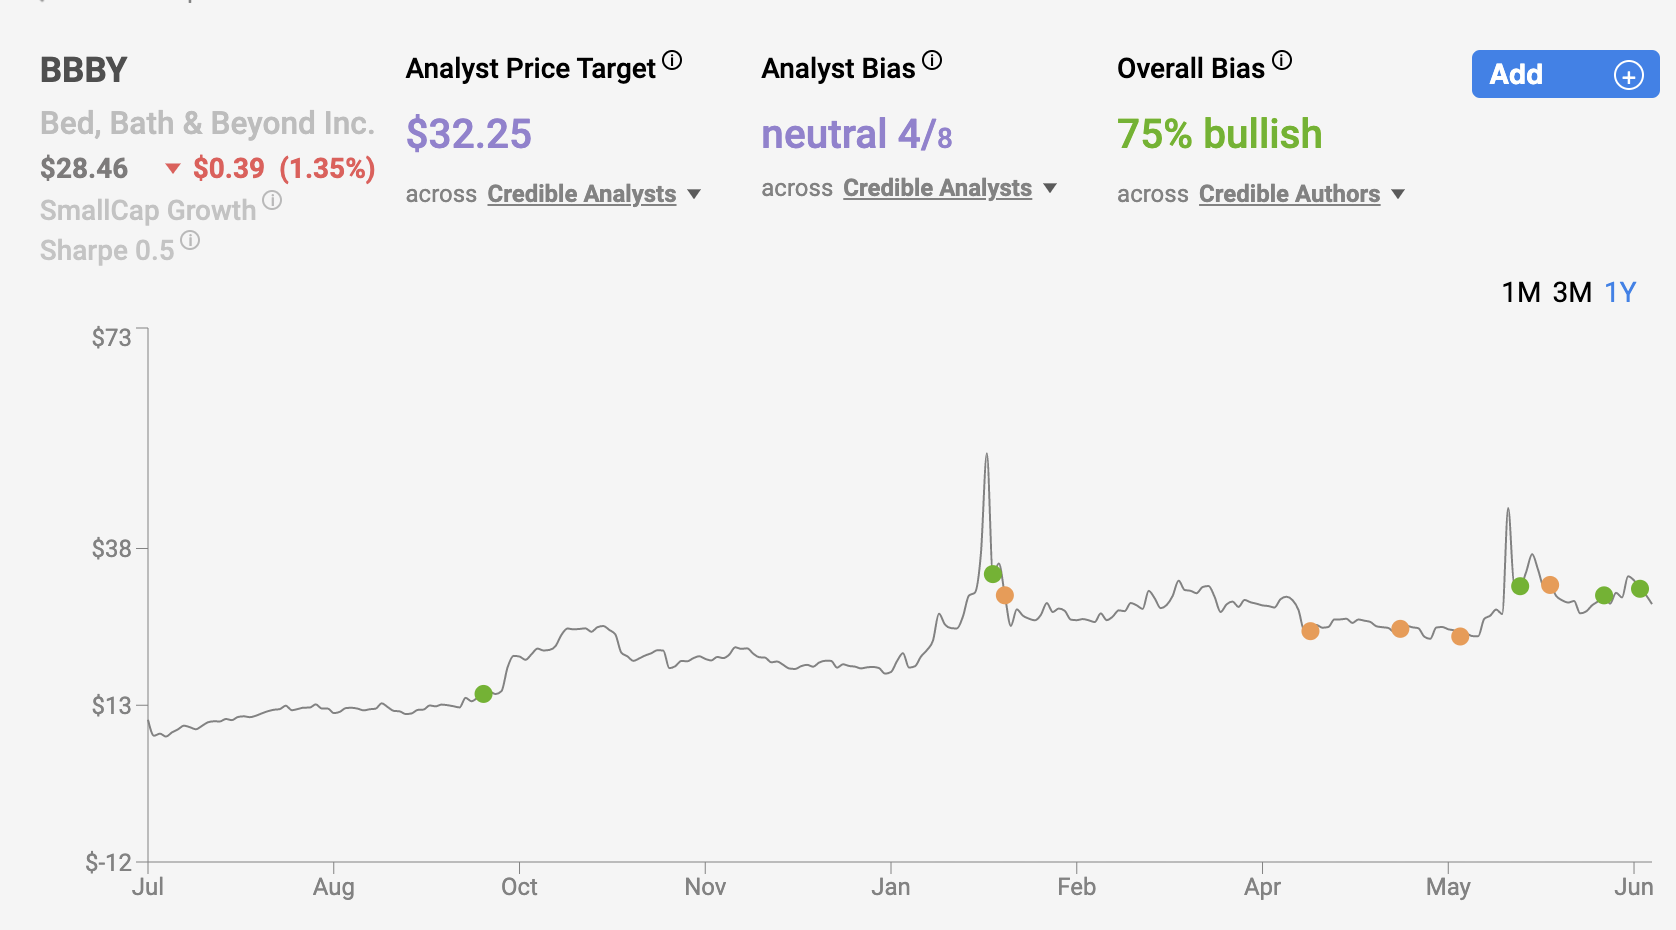
Dan Caplinger, a Nobias 4-star rated analyst, recently touched upon BBBY’s volatility in an article titled “These 2 Nasdaq Meme Stocks Crashed Back to Earth Thursday” in which he highlighted Bed Bath & Beyond’s double digit dip in early June. On June 1st, BBBY shares were trading for just $27/share. On June 2, they shot up to north of $44/share. And then on June 3rd, they gave up much of those gains, falling back down towards the $32/share level. “Nominally,” Caplinger wrote, “Bed Bath & Beyond's move higher Wednesday came on the heels of an announcement that it plans to focus more on private-label brands in its inventory. Doing so would potentially capture a greater portion of the profit margin available on the goods it sells, which would be a positive for investors.” However, he also noted BBBY’s participation in the “meme stock” trade and after this sell-off, he said, “Past episodes of retail investor buying have ended with price spikes in Bed Bath & Beyond proving to be very short lived. The stock is still above where it traded before the latest move higher. But without greater fundamental improvement in its business, Bed Bath & Beyond could have a tough time sustaining its recent outperformance.”
With regard to the company’s actual performance, Hassan Maishera, a Nobias 5-star rated analyst, recently posted a Q1 recap article on Yahoo Finance, breaking down BBBY’s recent results. He said, “Overall, net sales for Bed Bath & Beyond surged by 49% to $1.95 billion from $1.3 billion a year earlier, surpassing the $1.87 billion estimated by analysts. Digital sales accounted for 38% of the company’s total sales as more customers continue the trend of buying online and picking up the products at a nearby Bed Bath & Beyond store.”
Maishera continued, highlighting BBBY’s bottom-line results, writing, “Following its jump in sales, Bed Bath & Beyond Inc. reported earnings per share of 5 cents adjusted vs. 8 cents expected. Meanwhile, the revenue was $1.95 billion vs. $1.87 billion expected. The retail company also managed to reduce its net loss to $51 million, or 48 cents per share, from a loss of $302 million, or $2.44 per share in the same period last year.” In short, the stock beat analyst estimates on the top and bottom lines. Management provided an upbeat tone throughout the report and raised full-year guidance as well.
During the company’s first quarter press release, Mark Tritton, Bed Bath & Beyond's President and CEO said, "We have started the year in a position of strength and are clearly on track to accomplish our goals. 2021 marks the first year of our three-year transformation following the groundwork we laid in 2020 – a year of historic and necessary change for this organization against the backdrop of unprecedented challenges due to COVID-19. For the first quarter, we delivered our fourth consecutive quarter of comparable sales growth with gross margin expansion exceeding our expectations. These results demonstrate continued momentum with our strategies as we progress towards the goals we outlined at year-end and at our Investor Day."
Evan Niu, a Nobias 5-star rated analyst, highlighted management’s bullish guidance in a recent article, saying, “Thanks to the momentum, the company raised its guidance for fiscal 2021. Bed Bath & Beyond now expects total revenue to be in the range of $8.2 billion to $8.4 billion, up from a prior forecast of $8 billion to $8.2 billion. Comps are expected to be in the low-single digit growth range, compared to the previous expectation of around flat.”
It’s clear that investors have bought into this vision, with the shares up nicely since the results were posted. However, not all of the credible authors that we track are believers in BBBY’s turnaround. Demitri Kalogeropoulos, a Nobias 5-star rated analyst who writes for The Motley Fool, recently published a bearish piece on Bed Bath & Beyond, highlighting his preference for another big-box retailer, Target (TGT). Kalogeropoulos began his piece by noting that BBBY has bounced back nicely from the 2020 lows, though the company’s operations are still struggling to generate strong longer-term growth. He said, “CEO Mark Tritton and his team celebrated the specialty retailer's increasing growth and profitability rebounds at the start of fiscal 2021. But the business is still shrinking as it closes underperforming stores, and there's a lot of uncertainty about where profitability will land after management is done with the company's three-year restructuring plan.”
Nicholas Ward is a Senior Investment Analyst at Wide Moat Research. He has spent the last 8 years writing about the stock market at various publications, including Seeking Alpha, The Street, Forbes Real Estate Investor, Sure Dividend, The Dividend Kings, iREIT, Safe High Yield, and The Intelligent Dividend Investor.
Although BBBY’s revenue was up 73% from its 2020 trough levels, Kalogeropoulos was quick to note that the company’s sales only “rose 3% compared to 2019 levels”. He touched upon his belief that Bed Bath & Beyond has been late to the game in terms of the shift that we’ve seen the big-box retailers take with regards to adopting an omni-channel approach to sales. He wrote, “Bed Bath & Beyond is busy crafting an omnichannel selling platform that reflects consumers' growing desire to shop online and either pick up orders in stores or choose ultra-fast home deliveries.” And yet, even so, Kalogeropoulos believes that rival Target is the clear winner in the space, saying, “Simply put, you'll likely get better returns by owning a retailer with a proven multi-channel platform than by betting on a business that might build such a platform over time.”
Overall, the Nobias community has a favorable view of BBBY shares, with 75% of the credibly authors that our algorithm tracks posting a bullish outlook on shares. The average price target of the credible authors that we follow for Bed Bath & Beyond shares is $32.25. Today, BBBY shares trade for $30.28, which implies upside potential of 6.5%. During the past month, we’ve seen 4 and 5-star analysts post 19 research notes focused on the company. 11 of these came with “Buy” ratings. 3 of them offered “Neutral” opinions. And 5 of them were bearish.
As you can see, the majority of credible authors continue to be bullish on shares, which means that this turnaround story could turn out to be more than a “meme”. Bed Bath & Beyond is attempting to generate reliable fundamental growth which shareholders can benefit from over the long-term. Only time will tell if BBBY is able to carve out meaningful market share against its peers in the big-box retail space, yet the Nobias community of credible authors appears to believe that it can.
Disclosure: Nicholas Ward has no positions in any stocks mentioned in this article. Nicholas Ward wrote this article for Nobias at their request with a view of giving investors a balanced perspective based on the writings of Nobias highly rated analysts and bloggers. Nobias has no business relationship with any company whose stock is mentioned in this article and does not have a position in this stock.
Additional disclosure: All content is published and provided as an information source for investors capable of making their own investment decisions. None of the information offered should be construed to be advice or a recommendation that any particular security, portfolio of securities, transaction, or investment strategy is suitable for any specific person. The information offered is impersonal and not tailored to the investment needs of any specific person.
Disclaimer: The Nobias star rating is based on past performance results and is not an indicator of future results. These past performance returns do not represent returns that any investor actually earned. Assumptions made include the ability to purchase the stocks recommended by the author under liquid markets where the transaction would be at the market price for the day. In reality, loss in liquidity may have a material impact on the returns that actually may have been earned. Further, returns are calculated without any including transaction costs, management fees, performance fees or expenses, or reinvestment of dividends and other income. This information is provided for illustrative purposes only.
Morningstar's 5 Value Stocks with Nobias Machine Learning Insights
After reading this piece and seeing Morningstar’s list of bullish investment ideas, we wanted to cross check the Morningstar findings against the blue chip (4 and 5 star rated) analyst opinions tracked by the Nobias algorithm to see whether or not other credible individuals agreed or not. Here are our findings.

We recently came across an interesting article titled “5 Value Stocks With Room to Run” written by Lauren Solberg and Jakir Hossain at Morningstar. The article began by highlighting the recent sentiment shift that has occurred in the market throughout much of 2021, with investors seemingly more interested in owning value oriented names as a part of a reflation trend coming out of the pandemic, as opposed to the secular growth plays (largely tech companies) that have performed so well over the last decade (and remarkably well during 2020 during the COVID-19 pandemic period).
The authors wrote, “After years in the doghouse, value stocks are seeing their day in the sun as investors have shifted cash out of pricey, fast-growing company stocks.” They continued, saying, “However, many value stocks (which are technically defined as stocks with relatively low prices given pre-share earnings, book value, cash flow, sales, and dividend expectations) aren't such a bargain anymore.” In other words, the trend has played itself out. Investors looking to buy into value oriented names these days have largely missed the boat. Or...have they?
The Morningstar piece attempted to find the holy grail for value investors: high quality, wide moat companies that have been left behind by the market, implying irrationally low valuations that have the potential to result in strong long-term gains for investors. In doing so, they screened the Morningstar data looking for mid and large cap companies trading below fair value estimates with “wide moat” designations.
Morningstar defines a wide moat as, “a Morningstar designation for companies with long-term competitive advantages that allow them to earn oversize profits over time” Furthermore, the screen included a “stable Morningstar trend rating” which implies a bullish outlook with regard to growth trajectories and the companies’ ability to maintain their moats and market share positions in the face of inevitable disruption. With all of this in mind, the Morningstar piece landed on 5 stocks that value investors should be interested in today: Bristol-Myers Squibb (BMY), Dominion Energy (D), Gilead (GILD), Merck (MRK), and Wells Fargo (WFC).
After reading this piece and seeing Morningstar’s list of bullish investment ideas, we wanted to cross check the Morningstar findings against the blue chip (4 and 5 star rated) analyst opinions tracked by the Nobias algorithm to see whether or not other credible individuals agreed or not. Here are our findings.
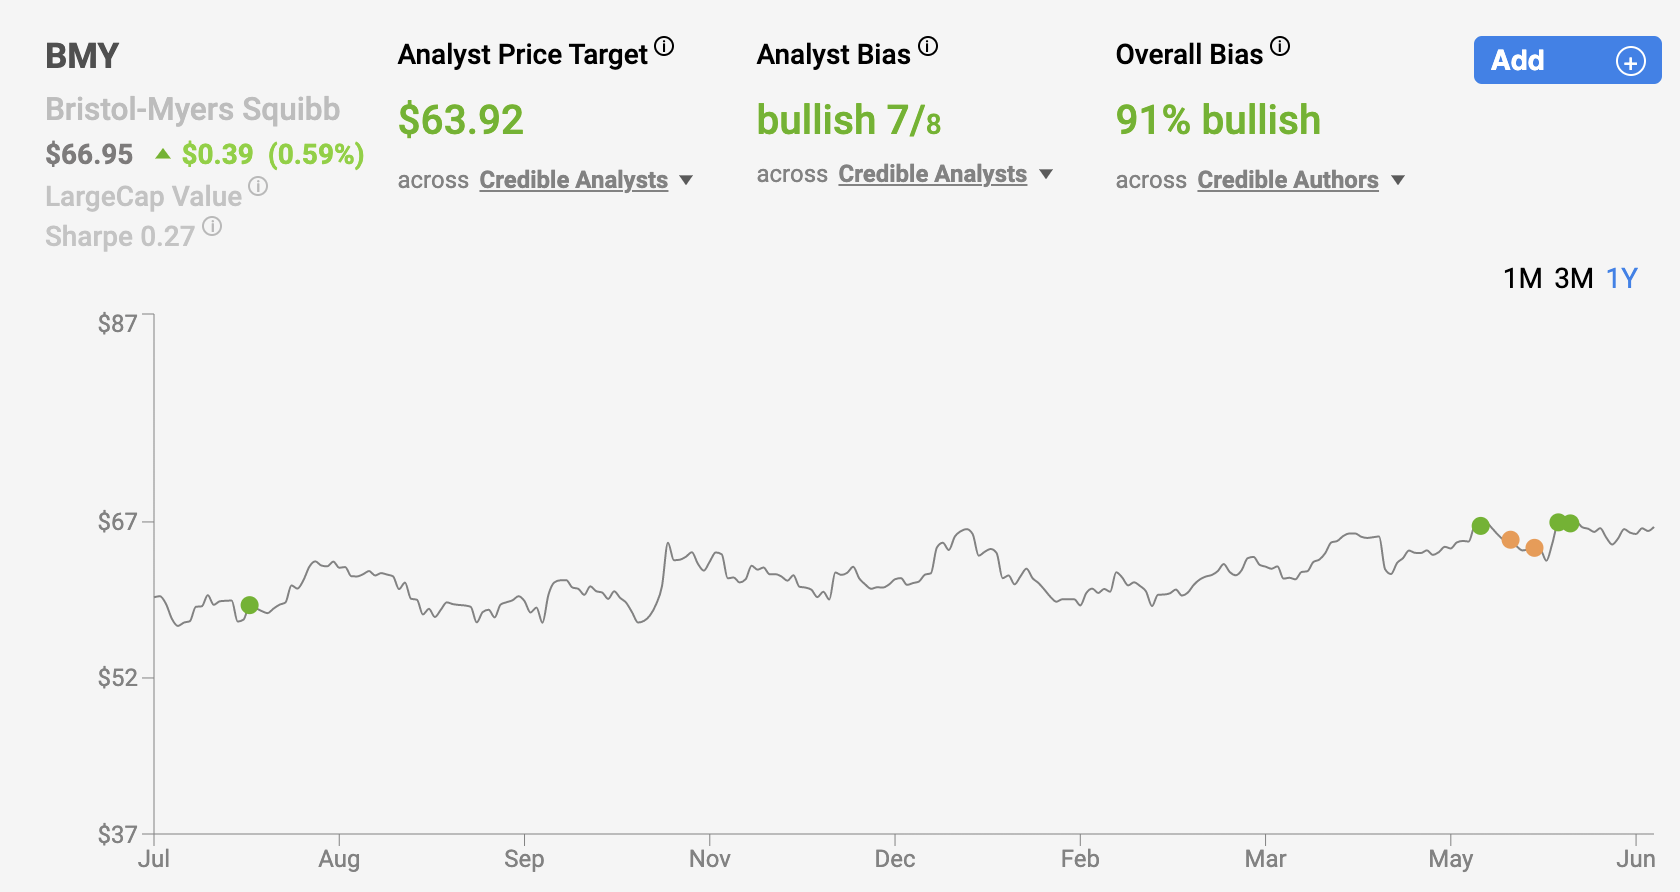
Bristol-Myers Squibb
Bristol-Myers is an interesting stock to follow. Shares have lagged the market for several years now, trading in a fairly well defined range between $45/share and $65/share dating back to late 2013. During this same period of time, the S&P 500 has rallied more than 150%. In other words, long-term BMY shareholders are likely displeased with their stock’s relative stagnation.
BMY shares have underperformed the market on a year-to-date basis as well, posting 7.72% growth during 2021 thus far, compared to the S&P 500’s 14.5% performance. And yet, the share price performance of Bristol-Myers does not match the growth of its underlying fundamentals. Over the last 5 years, BMY’s earnings-per-share has grown by more than 220%. So, while its share price has languished, its valuation has fallen. And now, BMY appears to be one of the cheapest large-cap stocks in the market on a trailing and forward looking price-to-earnings basis.
Right now, BMY’s forward P/E ratio is just 8.9x. That’s extremely low for a company expected to post 16% earnings-per-share growth this year. And, BMY’s share price has recently broken out above its $65 resistance. With that in mind, it’s not surprising to see that our algorithm tracks a 91% bullish bias amongst credible authors. During the last month alone, we’ve tracked 14 analyst reports published by 4 and 5-star authors. 9 of these reports included “Buy” ratings. Only 5 of them reported “Sell” ratings. So, even after BMY’s run-up to the $65 resistance level, nearly twice as many blue chip analysts are bullish on the company than those who are bearish.
In a recent article written for TheStreet.com, Nobias 4-star rated author Bruce Kamich broke down the technical tailwinds behind the recent BMY momentum and concluded, “Traders and investors should continue to hold existing longs and add to longs if they have room in their accounts. Stops could be raised to $63.”

Dominion Energy
Dominion Energy is in a bit of a transition period. The stock was in the news in recent years due to the negative headlines surrounding its pipeline plans and the eventual deal that it struck with Berkshire Hathaway to sell its pipeline business. Alongside this deal came a dividend cut as management laid out long-term growth plans which involved a more intense focus on alternative energy generation. Dominion’s earnings-per-share fell 17% in 2020, largely because of the assets that it divested in the Berkshire deal. Management said that its growth plans should enable the company to post mid-to-high single digit EPS growth moving forward and the analyst community appears to agree. Right now, the consensus annual EPS growth rate amongst all of the Wall Street analysts that cover Dominion in 2021 is 9%. The consensus Wall Street estimates for annual EPS growth rates in 2022 and 2023 are 7% and 6%, respectively. If these estimates come to fruition, it would mean that Dominion is one of the fastest growing large cap utility companies. However, even with these strong growth prospects being laid out for the future, investors sentiment surrounding the stock remains tepid, at best.
Since July 2020, when the Berkshire Deal and impending dividend cut was first announced, D shares have fallen from approximately $80/share to $74/share. This represents -7.5% growth during a period of time in which the S&P 500 rose nearly 39%. This large relative underperformance is likely why Dominion ended up on the Morningstar list. After its recent sell-off - and with renowned growth prospects in mind for 2021 and 2022 - Dominion’s forward price-to-earnings ratio is now back in line with its long-term ~17x average. With that in mind, combined with above average growth prospects, we aren’t surprised to see that 89% of the blue chip Nobias analysts who cover D shares are bullish.
The most recent analyst report that we’ve seen published by a credible source comes from Michael Weinstein, a Nobias 5-star rated analyst who works for Credit Suisse. In his report, Weinstein said, “Dominion Energy (NYSE:D) price target raised to $90 from $80 by Credit Suisse analyst Michael Weinstein. This maintains D as Outperform.”

Gilead
Gilead has been an embattled bio-tech stock for years. The company burst into prominence in 2013 when it posted 297% earnings-per-share growth on the back of its Hepatitis C franchise breakthrough. In 2014, Gild’s earnings posted another 56% growth, meaning that in 2 years, the company’s bottom-line has grown by more than 6x. Gilead essentially solved the Hep-C problem for the world, effectively treating it amongst a wide variety of patients. The problem was, by curing the disease, rather than simply managing its symptoms, the Hep-C franchise essentially ran out of patients to treat now GILD’s earnings-per-share fell off a cliff. From 2015-2019, Gilead posted negative year-over-year earnings growth. During this period of time, GILD’s EPS fell from $12.61/share to $6.63/share. The company’s share price suffered as well and after GILD’s 2020 results, where management was able to generate positive 7% growth, GILD shares are beginning to become very popular amongst value investors once again.
Right now, the broader analyst community expects to see GILD produce $7.17/share in earnings during 2021. At the stock’s current share price of $69/share, that implies a forward price-to-earnings ratio of 9.6x. This is below GILD’s peer average and the broader market’s forward average as well. It’s worth noting that not only is GILD’s valuation relatively low, but the stock’s dividend is relatively high. GILD’s dividend yield right now is 4.12%, which compares favorably to the S&P 500’s 1.30% yield. Although GILD’s earnings growth has suffered since 2015, the company has raised its annual dividend every year since initiating its dividend payments in mid-2015 and therefore, the apparent dividend safety alongside the abnormally high yield has made this a popular stock amongst income oriented investors.
GILD is also a favorite amongst the blue chip Nobias community. Right now, the credible authors that our algorithm tracks have an 88% bullish rating on the stock. GILD shares have performed well during 2021, posting year-to-date returns of 18.2%, which exceeds the 14.5% generated by the S&P 500 by a fairly wide margin. During the last month alone, GILD shares are up 4.16%, more than doubling the S&P 500’s 1.9% performance. And yet, even after this recent rally, Nobias 4 and 5-star rated analysts continue to maintain their bullish lean.
Over the last month, we’ve seen such analysts post 8 reports. 5 of those reports came with “Buy” ratings compared to just 3 “Sell” ratings. David Van Knapp, a Nobias 4-star rated analyst who publishes work at Dailytradealert.com recently wrote an in-depth analysis on GILD, noting that, “Gilead’s operating margin is higher than companies such as Merck (MRK), AbbVie (ABBV), Pfizer (PFE), and Amgen (AMGN). It is this strong cash production that supports Gilead’s dividend.” Van Knapp estimates that Gild’s fair value is $75/share and with that in mind, he concludes his piece saying, “Obviously, with Gilead currently trading so far below its fair price, there is no need to even think about its maximum buy price [Van Knapp believes that Gilead can be reasonably bought up to $83/share]. A good time to buy Gilead is right now, at a 17% discount.”

Merck
Merck’s story is very similar to the one previously discussed with Bristol-Myers Squibb. Like BMY, MRK is a leader in the global oncology space. Because of the success that it has had with its drug, Keytruda, which is widely expected to become the world’s top selling drug (in terms of total revenues) by 2025 after AbbVie’s Humira (which currently holds the top spot) loses patent protection in 2023, it wasn’t long ago that Merck was considered to be market darling.
During 2018 and 2019, MRK posted strong earnings growth on the heels of its Keytruda rollout (9% in 2018 followed by 20% in 2019) and during this period of time, Merck’s share price rose from approximately $50/share to $86/share. However, during 2020, the stock underperformed, falling from $86/share at the end of 2019 to $78/share at the end of 2020. The cautious sentiment surrounding the stock has stayed in place throughout 2021, with MRK shares largely trading in a range between $72 and $80.
What’s odd about this sentiment shift is that MRK’s underlying fundamentals continue to grow at a respectable pace. In 2020, Merck’s earnings-per-share increased by 14%. In 2021, the analyst community expects to see the company generate another 8% growth. And, in 2022, the consensus EPS estimate calls for a re-acceleration on the bottom-line, back up to 11% y/y growth. In short, the weakness being applied to MRK shares by the market does not appear to be justified when looking at the stock’s fundamentals. This discrepancy between negative share price performance and positive fundamental growth has resulted in Merck’s forward price-to-earnings ratio falling to just 12.74x.
During the last decade, Merck’s average P/E ratio is 14.6x, meaning that the current premium being applied to shares represents a ~12.5% discount. Right now, the credible authors that Nobias tracks have a $96.20 price target on MRK shares, which represents upside potential of roughly 23.3%. 92% of the credible authors that Nobias tracks have a bullish rating on MRK. During the last month we’ve seen 9 analyst reports posted by 4 and 5-star rated authors. 6 of them came with “Buy” ratings, 1 had a “Neutral” rating attached, and 2 had “Sell” ratings.
Recently, a Daina Greybosch, a Nobias 5-star rated analyst posted a note regarding Merck shares that read, “Merck & Co (NYSE:MRK) price target lowered to $99 from $102 by SVB Leerink analyst Daina Graybosch. This maintains MRK as Outperform.”

Wells Fargo
My how the mighty have fallen. It wasn’t long ago that WFC was viewed as the gold standard in the big-banking space, due to the strength it has with retail clients, especially in the mortgage space. Wells Fargo was a top holding within famed investor Warren Buffett’s portfolio at Berkshire Hathaway for decades. Buffett began building his WFC position in 1989, held his position for roughly 30 years, having eventually built up Berkshire’s position to approximately 10% of the bank’s shares. This Buffett/Berkshire association gave investors solace when it came to WFC shares, which is why the news that broke in 2016 regarding the bank’s ethics when it came to various illegal sales practices.
Shares of WFC have fallen precipitously since the scandalous news broke. In 2016, they were trading for north of $65/share and as recently as October of 2020, WFC was trading in the $20 area. What’s interesting however, is that while the bank’s share price and reputation has been hurt badly by the scandal news, the company’s fundamentals have remained relatively intact.
Nicholas Ward is a Senior Investment Analyst at Wide Moat Research. He has spent the last 8 years writing about the stock market at various publications, including Seeking Alpha, The Street, Forbes Real Estate Investor, Sure Dividend, The Dividend Kings, iREIT, Safe High Yield, and The Intelligent Dividend Investor.
In 2016, WFC’s earnings-per-share totaled $3.99. In 2019, WFC’s full-year EPS came in at $4.05. The company’s bottom-line struggled in a big way in 2020 due to pandemic related pressures and negative one-time items, resulting in full-year earnings-per-share of just $0.41 last year. However, the consensus analyst estimate for 2021 EPS currently sits at $3.76, which points to a quick bounce back, fundamentally speaking.
Berkshire Hathaway made news when it sold the vast majority of its WFC stake in early 2021. However, on a valuation basis, shares continue to look cheap, with a forward price-to-earnings ratio of just 12x. Although Mr. Buffett may have changed his tune when it comes to WFC shares, it appears that the market’s sentiment has turned positive. WFC is up approximately 50.5% year-to-date, making it ones of the best performing stocks in the market. However, even after this rally, there appears to be upside potential due to the longer-term underperformance dating back 5 years or so.
63% of credible authors that we track with the Nobias algorithm offer bullish commentary on WFC shares. During the last month, we’ve seen 4 and 5-star rated analysts post 3 reports on the company and each of them included a “Buy” rating. However, the bull case being presented for WFC shares by the blue chip Nobias authors isn’t quite as clear as the other 4 stocks on this list. Nothing in the stock market is ever certain and the average price target that we’re seeing when it comes to WFC clearly shows this. As you can see above, the average price target being presented by such analysts for WFC is $36.86 right now, which is actually 18% below the current share price. It appears that the stock’s recent rally has surprised analysts. This may point towards continued volatility moving forward due to a relatively high lack of certainty related to the trajectory of WFC shares.
Disclosure: Nicholas Ward is long shares of BMY and MRK. Nicholas Ward wrote this article for Nobias at their request with a view of giving investors a balanced perspective based on the writings of Nobias highly rated analysts and bloggers. Nobias has no business relationship with any company whose stock is mentioned in this article and does not have a position in this stock.
Additional disclosure: All content is published and provided as an information source for investors capable of making their own investment decisions. None of the information offered should be construed to be advice or a recommendation that any particular security, portfolio of securities, transaction, or investment strategy is suitable for any specific person. The information offered is impersonal and not tailored to the investment needs of any specific person.
Disclaimer: The Nobias star rating is based on past performance results and is not an indicator of future results. These past performance returns do not represent returns that any investor actually earned. Assumptions made include the ability to purchase the stocks recommended by the author under liquid markets where the transaction would be at the market price for the day. In reality, loss in liquidity may have a material impact on the returns that actually may have been earned. Further, returns are calculated without any including transaction costs, management fees, performance fees or expenses, or reinvestment of dividends and other income. This information is provided for illustrative purposes only.

Lockheed Martin: Is This Unloved Defense Stock Ready To Soar?
2021 has been a great year for the stock market thus far. Through the first half of the year, the S&P 500 was up approximately 14.5%. And, this rally has been fairly broad based with just about every sector benefitting from the re-opening and re-flation rally that we’re watching play out as the world emerges from the COVID-19 pandemic. However, one area of the market that has suffered, on a relative basis to the broader market, is the defense sector.
2021 has been a great year for the stock market thus far. Through the first half of the year, the S&P 500 was up approximately 14.5%. And, this rally has been fairly broad based with just about every sector benefitting from the re-opening and re-flation rally that we’re watching play out as the world emerges from the COVID-19 pandemic. However, one area of the market that has suffered, on a relative basis to the broader market, is the defense sector.
Defense stocks have struggled to keep up with the major averages ever since the election. There is a view in the market that the “blue wave” that we saw play out in November, which gave the Democratic party power to control the House, the Senate, and the Oval Office, is likely to be bad for defense names as more progressive politicians prioritize spending on things like healthcare, social benefits, and infrastructure, as opposed to the defense budget.
However, looking back at recent administrations from both parties, we see that this thesis doesn’t exactly hold up. Regardless of who is in the White House, there has typically been massive spending on defense. National security is a top priority of the majority of elected officials (and especially the U.S. President, being that they are the Commander and Chief of the U.S. armed forces). And with that in mind, we wanted to focus on the largest defense contractor, Lockheed Martin (LMT), to see whether or not the blue chip analysts that the Nobias algorithm tracks believe that this relative underperformer is an attractive buy or not.

We recently came across an article published by The Motley Fool titled “The S&P 500 Is Near an All-Time High, but These Stocks Are Still Cheap” which listed Lockheed Martin as an attractive bargain. The article began by saying, “Another day, another all-time high. The U.S. stock market is on fire and showing no signs of slowing down. When times are this good, it can be easy to get complacent and forget about fundamentals. Or worse, fall prey to the hype of meme stocks and other fast-money facades.” Thankfully, the authors provided picks for investors looking to buy high quality value stocks rather than chase momentum. Lockheed Martin, which is up approximately 7.5% on a year-to-date basis, representing roughly 50% underperformance relative to the S&P 500, was one of the bullish picks.
Daniel Foelber, a Nobias 5-star rated analyst, was one of the trio of authors who collaborated on this piece and in his section of the article, he listed Lockheed Martin as a top pick to consider in what is otherwise an expensive market. He noted that not only have LMT shares underperformed the market during 2021, but “Lockheed and its peers have heavily underperformed the market over the past three- and five-year periods.” However, as Foelber points out, this weak share price performance may be irrational. He says, “Lockheed posted record-high revenue, net income, and free cash flow (FCF) in 2020. Given its dominant performance, investors might be scratching their heads as to why Lockheed is so cheap.”
After all, he continues, “After all, its price-to-earnings ratio is just 15.3. And its quarterly dividend was raised to $2.60 a share, putting the annual yield at 2.7%. With plenty of FCF to support the dividend, Lockheed has the makings of a top-tier income stock.” He highlights the slowing defense budget growth in recent years as a primary concern for investors, being that Lockheed relies heavily on U.S. government contracts. However, he is quick to say, “The company has been able to rise above this challenge. Over the last five years, it has increased revenue at a compound annual growth rate (CAGR) of 6.7%, net income at a CAGR of 5.7%, and FCF at a CAGR of 9%.”
Foelber notes that President Biden’s recently proposed budget included 1.6% defense spending growth and that Lockheed’s “Investments in hypersonic missiles, satellites, and nuclear defense programs [that] make up its space segment” could be the primary sources of the company’s growth. He also notes that “famed growth investor” Cathie Wood, of Ark Invest, recently added Lockheed to her Ark Space Exploration ETF, which has helped turn the sentiment surrounding LMT shares bullish in recent months. Overall, Foelber concludes, “Lockheed seems like a steal at its current price.”
Jason Fieber, a Nobias 5-star rated analyst who posts articles at dailytraderalert.com, also recently covered Lockheed Martin with a bullish light. He discussed Lockheed Martin in his article titled “3 Dividend Growth Stocks Still Priced Below Pre-Pandemic Highs” by saying, “Sovereign defense products and services have always been necessary and always will be necessary. That’s just human nature. Investing in these businesses is almost a total slam dunk over the long run. However, sometimes you’re offered a particularly good opportunity with them, and that could be what you’re looking at with Lockheed Martin.”
Fieber notes, “This stock is currently priced around $385/share. But it was well over $400/share in early 2020.” With regard to fundamental value, Fieber said, “Lockheed Martin produced $21.95 in EPS for 2019, so going into 2020 that’s the earnings number. The company has logged $24.78 in EPS over the last 12 months. EPS is up more than 10% compared to early 2020, yet the stock is down more than 10%. That’s the advantageous disconnect I’m talking about.” He concluded his Lockheed section, writing, “Fundamentally, the business is excellent. They’ve increased their dividend for 18 consecutive years, with a 10-year DGR of 14%. The stock yields 2.7%, which is very attractive in this market. Lockheed Martin is actually one of my top five stocks for 2021.”
Nicholas Ward is a Senior Investment Analyst at Wide Moat Research. He has spent the last 8 years writing about the stock market at various publications, including Seeking Alpha, The Street, Forbes Real Estate Investor, Sure Dividend, The Dividend Kings, iREIT, Safe High Yield, and The Intelligent Dividend Investor.
Valueinvestingnews.com recently covered Lockheed Martin as well. The Nobias 5-star rated contributor also highlighted what they believe to be appealing fundamentals. They wrote, “Lockheed Martin's revenue increased 8 percent over the past trailing twelve-month period versus the previous twelve-month period. Gross margins increased to 15.73% for the first quarter compared to the same period in the previous year, and operating margins increased to 13.67% over the same period. Net earnings for past trailing twelve months were $7008.0 million, up 12% from the prior year.”
Value Investing News continued, touching upon the company’s strengthening balance sheet, saying, “Moving on to the balance sheet, Lockheed Martin’s cash levels jumped 48% for the third quarter over the same period last year. Overall liquidity of the balance sheet, as measured by the current ratio, increased 12.05% this past year. The current ratio for Lockheed Martin now stands at 1.38. The company decreased shares outstanding by 0.87%.” Lastly, they concluded, “In terms of valuation, the stock is trading at a trailing twelve-month price to earnings ratio of 15.63 and price to book ratio of 17.18.”
Right now, the S&P 500’s forward price-to-earnings ratio is north of 22x. With that in mind, it appears that LMT offers an attractive margin of safety. 87% of the credible analysts tracked by the Nobias algorithm agree with the bullish sentiment that we’ve seen posted over the last month. Right now, the average price target provided by blue chip analysts for LMT shares is $413. Today, shares trade for $381.49, which implies upside potential of approximately 8.3%. Adding the company’s 2.75% dividend yield into this equation, we arrive at a situation where double digit returns are possible. During the last month, we’ve seen 5 research reports posted by 4 and 5-star rated Nobias analysts. All 5 of them came with “Buy” ratings on the stock.
Disclosure: Nicholas Ward is long LMT. Nicholas Ward wrote this article for Nobias at their request with a view of giving investors a balanced perspective based on the writings of Nobias highly rated analysts and bloggers. Nobias has no business relationship with any company whose stock is mentioned in this article and does not have a position in this stock.
Additional disclosure: All content is published and provided as an information source for investors capable of making their own investment decisions. None of the information offered should be construed to be advice or a recommendation that any particular security, portfolio of securities, transaction, or investment strategy is suitable for any specific person. The information offered is impersonal and not tailored to the investment needs of any specific person.
Disclaimer: The Nobias star rating is based on past performance results and is not an indicator of future results. These past performance returns do not represent returns that any investor actually earned. Assumptions made include the ability to purchase the stocks recommended by the author under liquid markets where the transaction would be at the market price for the day. In reality, loss in liquidity may have a material impact on the returns that actually may have been earned. Further, returns are calculated without any including transaction costs, management fees, performance fees or expenses, or reinvestment of dividends and other income. This information is provided for illustrative purposes only.
Carnival Cruise Lines with Nobias Machine Learning: Does The Recent Rally Mean Clear Sailing Ahead?
It’s possible to make a very strong argument that the cruise line industry has been hurt more than any other by the COVID-19 pandemic. Social distancing measures and travel regulations have essentially shut down this global industry for over a year now. And yet, it is very expensive to maintain the large fleets that these companies own, regardless of whether or not they’re sailing with customers, meaning that we’ve witnessed large negative cash flows coming from this industry since the pandemic began. This has forced the cruise lines to raise enormous amounts of debt and to dilute their shareholder bases with equity offerings. There is still a lot of uncertainty surrounding when, or even if, this industry will return to normal and if there’s one thing the stock market hates, it’s uncertainty.
It’s possible to make a very strong argument that the cruise line industry has been hurt more than any other by the COVID-19 pandemic. Social distancing measures and travel regulations have essentially shut down this global industry for over a year now. And yet, it is very expensive to maintain the large fleets that these companies own, regardless of whether or not they’re sailing with customers, meaning that we’ve witnessed large negative cash flows coming from this industry since the pandemic began. This has forced the cruise lines to raise enormous amounts of debt and to dilute their shareholder bases with equity offerings. There is still a lot of uncertainty surrounding when, or even if, this industry will return to normal and if there’s one thing the stock market hates, it’s uncertainty.
Looking back to the end of January 2020, Carnival Cruise Lines (CCL) shares are down nearly 44% from their pre-pandemic levels. Royal Caribbean (RCL) shares are down roughly 26.5% from their January 31st, 2020 share price. And, Norwegian Cruise Lines (NCLH) are down slightly more than 48.2%. And yet, throughout 2021, the cruise lines have fared better, due to hopes of strong demand for travel when once the world’s economy reopens in a post-COVID era. RCL shares up are 15.2% thus far throughout 2021, beating the S&P 500 by a slim margin. NCLH shares are up 14.04% year-to-date, posting slight underperformance. And CCL, the world’s largest cruise line, has the best year-to-date performance of the bunch, is up 20.31%. With this in mind, we wanted to take a look at what the blue chip Nobias analysts (4 and 5-star rated individuals) had to say about CCL shares after their recent rally.
Even after their 20%+ year-to-date performance, CCL is still well off of its pre-pandemic highs, which may point to significant upside potential left in the tank. Does this company have clear sailing ahead? Let’s see what the algorithm says! Melanie Schaffer, a Nobias 4-star rated analyst, recently published a bullish article on CCL shares on iqstockmarket.com. She wrote, “On April 7, Carnival reported a first-quarter 2021 loss of $2 billion compared to revenue of $150 million for the same quarter the year prior.”
This is obviously bad news for the company; however, she also highlighted management’s fleet expansion plans, saying, “The cruise line announced it would add two additional ships to its fleet by 2023, signaling an expected surge in customers.” It’s the idea that there is strong pent up demand for travel that is driving the bullish sentiment surrounding CCL shares in recent months.

Eric Volkman, a Nobias 4-star rated analyst who writes for The Motley Fool, recently covered the reopening of the cruise industry in an article, saying, “In yet another sign that the travel industry is poised for a monster comeback this summer, Carnival formally announced the restart of U.S. sailings.” Volkman continued, “The company, whose operations virtually ground to a standstill during the coronavirus pandemic, said the Galveston sailings will resume on Saturday, July 3 with the Carnival Vista. This will [be] followed shortly thereafter by the Carnival Breeze, which will start ferrying customers on July 15.”
Carnival is still having issues with jurisdictions that require proof of vaccination to sail. The Vista and Breeze ships will require full vaccination, yet the company is hoping that states where cruising is an important industry will lessen those requirements. Volkman highlighted this, saying, “In the company's press release on the resumptions, it quoted Carnival Cruise Line president Christine Duffy as explaining that "the current [U.S. Centers for Disease Control and Prevention, or CDC] requirements for cruising with a guest base that is unvaccinated will make it very difficult to deliver the experience our guests expect, especially given the large number of families with younger children who sail with us."’
Kate Stalter, a Nobias 4-star rated analyst, recently published a Carnival article on Yahoo Finance, which highlighted the “optimistic forecasts” that CCL management recently provided investors. Stalter said that according to the company’s recent press release, Carnival had $9.3 billion of cash and short-term investments at the end of Q2, “which the company believes is sufficient liquidity to resume full cruise operations.” She noted that the company said, “The monthly average cash burn rate for the first half of 2021 was $500 million, which was better than forecast, mainly due to the timing of proceeds from ship sales and working capital changes.”
Stalter continued, highlighting the fact that “42 ships from eight of the company's nine brands either have resumed operations or are scheduled to resume operations by the end of November. That tally represents more than 50% of the company's capacity, with more announcements expected in the coming weeks.” Lastly, she noted that “Cumulative advanced bookings for the full year of 2022 are ahead of a very strong 2019, despite minimal advertising or marketing.”
Moving on to the company’s balance sheet, Stalter did note that while management has worked hard to restructure the debt that it raised during the pandemic (CCL had $25.97 billion of long-term debt on its balance sheet at the end of its most recent quarter), the headwinds that this debt load creates are likely going to be around for years to come. She said, “CEO Arnold Donald also restructured the existing debt. He negotiated with creditors to move debt maturities out further, waive some debt covenants and even exchange some debt for equity. Meanwhile, he was able to raise $10 billion in new equity and debt to keep the company afloat.”
However, believes that Carnival is “not currently in a buy range” due to technical pressures and said, “This is a stock that appears to need a long cruising time to reach fundamental health, and it’s possible the increased debt load will be a problem for the foreseeable future.” Spreading of technical pressures, Mark Putrino, a Nobias 4-star rated analyst, recently published an article on Benzinga titled “Shorts Get Crushed After Carnival’s Stock Breaks Out” which highlighted his bullish outlook on the stock from a trader’s perspective.
In his article, Putrino argues that after the stock’s recent rally, the negative pressure that short sellers have been putting on CCL shares is likely to abate, clearing the way for more upside in the future. He said, “For three months, sellers kept a top on shares of Carnival Corporation (NYSE:CCL). Each time shares reached the $30 level, sellers overpowered the buyers and drove the price lower.” “But now,” he says, “things are different.” His thesis is that CCL’s recent rally above $30 means that “the sellers who created the resistance have left the market. With this supply out of the way, the stage is set for a new uptrend to form.”
Unfortunately for Bulls, this thesis has not yet played out. CCL shares rallied up to recent highs above $31 in early June; however, since then, we’ve seen another share price slump back down to today’s share price of $26.06/share. As of 6/15/2021, CCL’s short interest was 58.83 million shares. This represents roughly 7% of the company’s total float. This is still a significant percentage, which implies that there is still a strong negative sentiment that surrounds the stock. However, it also implies that a short-squeeze remains a possibility, which is something that traders like Putrino will be on the look out for.
Nicholas Ward is a Senior Investment Analyst at Wide Moat Research. He has spent the last 8 years writing about the stock market at various publications, including Seeking Alpha, The Street, Forbes Real Estate Investor, Sure Dividend, The Dividend Kings, iREIT, Safe High Yield, and The Intelligent Dividend Investor.
Putrino isn’t the only analyst who’s recently come out with a bullish report calling for significant upside. Volkman published another CCL article at thefool.com, highlighting an upgrade from Steven Wieczynski, a noted analyst at Stifel, in which he raised his price target on CCL shares from $37 to $39. Volkman noted, “The new target is nearly 40% above the shares' most recent closing price.” However, he also acknowledges that Wieczynski’s move “is somewhat contrarian, as it comes a day after Carnival published a business update saying that it could book a massive non-GAAP loss of just over $2 billion for its Q2.
Volkman quotes Wieczynski as saying that the "Recent sell-off in CCL shares presents an attractive buying opportunity especially as the risk of additional dilutive equity/debt raises is not likely from here." The Stifel analyst continued, saying, “From here we actually see CCL being able to refinance large chunks of their debt structure which should lead to material interest savings down the road.” Overall, the majority of the credible authors that we track with the Nobias algorithm maintain a bullish stance when it comes to CCL shares with a 78% bullish rating.
However, in recent months, as the share price has rallied, we’re seeing a more balanced blend of bulls and bears come out as higher share prices diminish the stock’s margin of safety. During Q2, we’ve seen 11 reports published by 4 and 5-star rated analysts. 6 of those reports included “Buy” ratings while 5 of them fell into the “Sell” category. The average price target that we see amongst credible analysts on CCL is $30.33/share. Today, CCL trades for $26.05, which implies upside potential of approximately 16.4%.
Disclosure: Nicholas Ward has no position in any stock mentioned in this article. Nicholas Ward wrote this article for Nobias at their request with a view of giving investors a balanced perspective based on the writings of Nobias highly rated analysts and bloggers. Nobias has no business relationship with any company whose stock is mentioned in this article and does not have a position in this stock.
Additional disclosure: All content is published and provided as an information source for investors capable of making their own investment decisions. None of the information offered should be construed to be advice or a recommendation that any particular security, portfolio of securities, transaction, or investment strategy is suitable for any specific person. The information offered is impersonal and not tailored to the investment needs of any specific person.
Disclaimer: The Nobias star rating is based on past performance results and is not an indicator of future results. These past performance returns do not represent returns that any investor actually earned. Assumptions made include the ability to purchase the stocks recommended by the author under liquid markets where the transaction would be at the market price for the day. In reality, loss in liquidity may have a material impact on the returns that actually may have been earned. Further, returns are calculated without any including transaction costs, management fees, performance fees or expenses, or reinvestment of dividends and other income. This information is provided for illustrative purposes only.
Splunk: Does It Have What It Takes To Return To Profitability Amidst Its Cloud Transition?
Splunk (SPLK) has been a bit of a head scratcher for investors over the last couple of years. Coming into the pandemic, when tech stocks roared due to the belief that the secular growth associated with things like cloud expansion, SPLK shares benefitted. The company traded down to below $100/share during the worst of the pandemic sell-off last March before rallying strongly to highs above $225/share during September of 2020. And yet, since then, SPLK has experienced a precipitous sell-off with shares hitting their new 52-week lows of just $110 in early May of 2021. SPLK has popped a bit off of those lows throughout June and now sits at $141.24. But, that’s a far cry from its highs. With SPLK trading with an approximate 37.5% discount to its 52-week high, we wanted to dive into the recent research reports provided by the 4 and 5-star analysts that the Nobias algorithm tracks to see whether or not this is a dip that investors should consider buying.
Splunk (SPLK) has been a bit of a head scratcher for investors over the last couple of years. Coming into the pandemic, when tech stocks roared due to the belief that the secular growth associated with things like cloud expansion, SPLK shares benefitted. The company traded down to below $100/share during the worst of the pandemic sell-off last March before rallying strongly to highs above $225/share during September of 2020. And yet, since then, SPLK has experienced a precipitous sell-off with shares hitting their new 52-week lows of just $110 in early May of 2021. SPLK has popped a bit off of those lows throughout June and now sits at $141.24. But, that’s a far cry from its highs. With SPLK trading with an approximate 37.5% discount to its 52-week high, we wanted to dive into the recent research reports provided by the 4 and 5-star analysts that the Nobias algorithm tracks to see whether or not this is a dip that investors should consider buying.
When investors hear terms like “big data” or “the cloud” they’re oftentimes confused because of the ambiguity of these terms and the industries that they represent. However, in a recent piece highlighting Splunk’s Q1 results which were posted in early June, Mike Wheatley, a 4-star rated Nobias analyst who writes for SiliconAngle.com, described Splunk’s business model in more detail. He said,“Splunk sells tools that are used by enterprises to monitor, search, analyze and visualize machine-generated data in real time. Essentially, it provides easy access to enterprise’s operational data and delivers insights that can aid in business decision-making.”
Where a lot of the recent weakness has come from in Splunk’s shares is the necessary transition from its slow-growth legacy software sales to a cloud-based software model which relies on the higher margin recurring sales that provide predictable earning’s results that Wall Street loves.

With regard to this transition, Wheatley said, “The company has been steadily pushing its customers to cloud-based versions of its software. That has seen its revenue model change from one that’s based on perpetual licenses to cloud subscriptions, which provide a more predictable income stream. Today’s results show that the company is making good progress in that transition.” During his piece, Wheatley mentioned that Splunk’s Chief Executive Doug Merritt recently had an interview with Barron’s, which focused on this cloud-based transition. Wheatley wrote, “Merritt told Barron’s in an interview that from a technology point of view, the company has more or less completed its transition. All of its software is now available in the cloud, on a subscription basis, he said. However, he said the company still has work to do on the financial side of the transition.”
It’s the speculation that still exists with regard to whether or not Splunk can return to profitability (in 2020, Splunk generated $1.88 in earnings-per-share; however, in 2021, that figure is expected to go negative, with the consensus analyst estimate coming in at -$0.55/share) that is holding SPLK shares down at the moment.
Daniel Newman, a Nobias 4-star rated analyst, recently published an article at futurumresarch.com, which highlighted Splunk’s recent Q1 results. As you can see below, there was a lot of growth to be seen, which has inspired the most recent leg-up in the stock from ~$115 to ~$140. In his piece, Newman highlighted Splunk’s Q1 results by listing these impressive metrics:
Cloud ARR was $877 million, up 83% year-over-year.
Total ARR was $2.47 billion, up 39% year-over-year.
Cloud revenue was $194 million, up 73% year-over-year.
Total revenues were $502 million, up 16% year-over-year.
203 customers with Cloud ARR greater than $1 million, up 99% year-over-year.
537 customers with Total ARR greater than $1 million, up 46% year-over-year.
However, even with so much seemingly strong double digit growth at play, Newman said, ‘EPS is still negative, indicating significant resources being invested in growth, and being slightly worse than estimates, the street was hard on the stock after earnings.” He continued, “Having said that, I believe the company is in the middle of an important pivot and while negative EPS isn’t ideal, shifting to Splunk Cloud, and making the necessary investments to accomplish this is the appropriate course of action at the current juncture.”
Newman noted that Splunk did not provide full-year guidance in the Q1 report, but looking at the recent results, he came away with a bullish outlook. He concluded his piece saying, “Also, the overall revenue growth YoY was solid and the EPS loss isn’t atypical of a high-growth company. Especially one that is in a notable transition from licensing to subscription models. The trend lines are encouraging and the growth in adoption of Splunk’s technology and the strong conversion of revenue to ARR should traverse in the next fiscal year returning the top line to growth.
Nicholas Rossolillo, a Nobias 4-star rated analyst who publishes content at The Motley Fool, recently penned an article which highlights the potential pros and cons of a SPLK investment. He began his piece showing the conundrum that SPLK presents investors, saying, “Part of the reason for the underperformance is that Splunk is undergoing a transition to the cloud, and said transformation is creating some headwinds for the company's overall growth profile. It is still growing, but is valued far cheaper than its peers. On one hand, it might pay off to be patient with Splunk -- but there are also reasons to cut bait and invest elsewhere in the data analytics and observability software space.”
Rossolillo notes that SPLK’s attempt to transition the majority of its revenues to the cloud space has created an odd discrepancy between its cloud revenue and its overall sales. He said that SPLK’s first quarter revenues increased by 16% year-over-year, which was great considering that in 2020, the company posted -5% revenue growth compared to 2019’s total. However, when investors dive into the Q1 results, they’ll still see major headwinds when it comes to Splunk’s turnaround attempt.
Rossolillo said, “Within this headline result, the company actually reported annual recurring revenue (ARR) of $2.47 billion, a 39% year-over-year increase. Why the big discrepancy? ARR accounts for all sales on an annualized basis, including the company's cloud-based products and older legacy software.” He continued, saying, “Put simply, Splunk Cloud is growing at a rapid pace (cloud-only ARR increased 83% year over year in Q1), but its other service revenue is stagnant at best. And since cloud ARR was just over one-third of the total in Q1, overall revenue growth is much slower than the ARR metric would indicate.”
Rossolillo doesn’t expect to see the disconnect between cloud and legacy revenues to disappear in the near-term and therefore, the headwind that stagnant legacy sales present is likely to continue to weigh on the stock’s valuation. Yet, because of Splunk’s big sell-off throughout 2021, the stock now trades at a discount to its smaller, yet faster growing peers. And therefore, he believes that there is opportunity, assuming that Splunk’s management can execute and transition a larger percentage of the company’s sales into the faster growing cloud space in the coming years.
With regard to his personal position, Rossolillo said, “Its smaller peers trade for 20 times trailing one-year sales or more -- although they are growing at a faster clip. So I'm choosing to be patient with my existing Splunk position for now.”
More recently, on June 22, 2021, Splunk investors received good news in the form of famed technology investment company, Silver Lake, buying $1 billion of Splunk’s convertible notes as an investment in the company which is meant to help its cloud transition.
n the press release associated with the investment, Merritt was quoted as saying, “We’ve significantly evolved our business since we began our transformation to become a cloud-first company over two years ago, and today’s announcement reaffirms the strength of our business fundamentals, cloud strategy and high-growth trajectory,”
Nicholas Ward is a Senior Investment Analyst at Wide Moat Research. He has spent the last 8 years writing about the stock market at various publications, including Seeking Alpha, The Street, Forbes Real Estate Investor, Sure Dividend, The Dividend Kings, iREIT, Safe High Yield, and The Intelligent Dividend Investor.
The SPLK CEO continued, saying, “Silver Lake has a strong reputation and track record of investing in innovative technology companies, and with their support, we are accelerating toward our goals as we deliver the most scalable and powerful data platform in the cloud.”
Daniel Sparks, a Nobias 4-star rated analyst who writes for The Motley Fool, published an article highlighting the 11.5% jump that the investment news inspired in SPLK shares. In his piece, he highlighted Splunk’s apparent plans for the incoming Silver Lake cash saying, “Interestingly, Splunk will not use the proceeds from the investment only to fund its transformation and growth initiatives but also to improve its capital structure and potentially even repurchase shares. Along with this transaction, Splunk's board announced the authorization of repurchasing up to $1 billion of its stock. The repurchase plan, however, is primarily intended to offset any dilutive effect of the notes.”
Overall, it appears that the 4 and 5-star rated analysts that Nobias tracks are in Silver Lake’s bullish boat. Since the start of June, we’ve seen 22 reports published on SPLK shares. Of those reports, 17 came with “Buy” ratings, compared to 3 “Neutral” sentiment reports, and just 2 “Sell” ratings. We’ve seen 11 analysts update their price targets for SPLK shares. Those fair value estimates range from $125 to $200 and the average amongst them is $163.09. When looking at the average price target from the credible group of analysts that we track, we see that upside potential from today’s $141.24 share price appears to be approximately 15.5%.
Disclosure: Nicholas Ward has no position in any stock mentioned in this article. Nicholas Ward wrote this article for Nobias at their request with a view of giving investors a balanced perspective based on the writings of Nobias highly rated analysts and bloggers. Nobias has no business relationship with any company whose stock is mentioned in this article and does not have a position in this stock.
Additional disclosure: All content is published and provided as an information source for investors capable of making their own investment decisions. None of the information offered should be construed to be advice or a recommendation that any particular security, portfolio of securities, transaction, or investment strategy is suitable for any specific person. The information offered is impersonal and not tailored to the investment needs of any specific person.
Disclaimer: The Nobias star rating is based on past performance results and is not an indicator of future results. These past performance returns do not represent returns that any investor actually earned. Assumptions made include the ability to purchase the stocks recommended by the author under liquid markets where the transaction would be at the market price for the day. In reality, loss in liquidity may have a material impact on the returns that actually may have been earned. Further, returns are calculated without any including transaction costs, management fees, performance fees or expenses, or reinvestment of dividends and other income. This information is provided for illustrative purposes only.
Roku: Shares Have Rallied Nearly 25% During The Last Month - Are They Still A Buy?
The cord-cutting phenomena has been playing out in the media/entertainment space for a while now. Back in 2015, traditional content distributors, such as The Walt Disney Company (DIS) or Comcast (CMCSA), began to see their share prices stagnate. Just about every company associated with the traditional, linear cable model struggled while Netflix (NFLX) shares sky-rocketed, due to that company’s massive leadership in the streaming space.
During the last 5 years, NFLX shares are up approximately 500%, making this stock one of the best large cap investments that someone could have made in the market during this period of time. However, Netflix isn’t the best performing streaming name in recent years. That title goes to Roku (ROKU). ROKU IPOed in late 2017 and its shares began trading in the $20 area. Well, today, ROKU shares are valued at $430.94, which means they’ve risen by more than 18x their original value.
Yet, in terms of investing, what’s in the past is in the past. It’s great to look at performance like ROKU’s; yet, the only thing that matters to someone thinking about buying shares today is how the company performs moving forward into the future. With that in mind, we wanted to take a look at the recent reports published by analysts rated 4 and 5-stars by the Nobias algorithm to see if the sentiment amongst these credible individuals continued to be bullish.
For those unfamiliar with Roku’s business model, it is a service that allows consumers to access all of their streaming apps in one seamless and easy to use place. Roku also invests in its own channel and content as well, though as of now, the driving force behind Roku subscriptions appears to be the consumer’s desire to consolidate their services and access them via a single dashboard.

In his recent article at The Motley Fool titled “3 Reasons Roku Will Keep Growing Faster in 2021” Nobas 4-star rated analyst, Adam Levy, highlighted the growing demand for Roku’s services by mentioning that management recently provided guidance which stated, "We expect net adds of both active accounts and streaming hours to be above pre-COVID-19 levels."
In other words, Roku’s management doesn’t see a post-COVID-19 slow down, which is a fear amongst certain investors now that society is re-opening and people will have more activities to choose from rather than being stuck inside of their homes streaming content. It’s the fear surrounding this “re-opening” trade that caused ROKU shares to fall from their current 52-week highs of $486.72 to recent lows in the $285 area in early May.
However, since then, we’ve seen shares rebound strongly as people come to terms with the strong secular nature of the streaming trend. Levy continued his piece, highlighting why demand will continue to grow for Roku’s services, mentioning the broad roll-out of individual streaming services that is expected to occur over the next year or so. He wrote, “Broadly speaking, media companies are adopting direct-to-consumer streaming and making more of their content available on connected-TV platforms. And Roku is investing in content for its Roku Channel. With more content available to stream than ever before, it should see an increase in user engagement.”
Another one of the primary components of Levy’s bullish outlook is Roku’s international growth prospects. He said, “While Roku is already the most popular connected-TV platform in the U.S., it's still in the early days of its international expansion.” He mentions that Roku is already the number 1 smart TV platform in Canada and the number 2 smart TV service in Mexico. Levy says, “Roku has an additional advantage in international markets: Viewers in those markets are more prone to engage with ad-supported content versus subscription services. Those services are a bigger focus for Roku than they are for its competitors, and The Roku Channel gives it an additional leg up.”
Lastly, Levy continues, the secular nature of the cord cutting phenomena is not going to end anytime soon, with consumers still flocking towards on-demand content services. He mentions that “Roku operates under the assumption that all TV will become streaming media. That said, Americans spent an average of 3.5 hours per day watching traditional TV in 2020, according to an estimate from eMarketer. The analysts expect TV viewing to decline by 16 minutes per day this year, and about half of that time will be shifted into consuming media on connected devices and platforms like Roku's.” He notes that without a global pandemic going on and Presidential elections occurring in the U.S., the demand for news-like services is likely to fall, relative to entertainment content. He concludes his piece, writing, “cord-cutting is on course to accelerate in 2021, and that trend is forecast to continue throughout the decade.”
With this in mind, he expects Roku to continue to produce growth in terms of subscribers and user engagement. As Roku’s subscriber base grows, so will the company’s advertising dollars. This was the major catalyst for a recent upgrade that ROKU shares received from Loop Capital analyst, Alan Gould.
Erik Volkman, a Nobias 4-star rated analyst, recently covered this upgrade for The Motley Fool. In his article, he explained that the Loop upgrade was why ROKU shares popped roughly 5.5% in a recent trading session. Volkman said, “Gould was inspired by researcher Magna Global raising its estimate for 2021 worldwide advertising revenue, with anticipated 24% year-over-year growth in digital video ads.”
Volkman highlighted many of the same aspects of the cord-cutting secular growth trend that Roku benefits from that Levy touched upon. However, Volkman also noted that during the recent Amazon Prime Day, Roku was likely one of the major benefactors, which has the potential to inspire a short-term bump to its subscriber base. He said, “And a suite of Roku products is being sold at significant discounts during Amazon's (AMZN) annual Prime Day shopping frenzy that kicked off on Monday. These often find their way into articles concerning the best Prime Day deals; this lifts Roku's visibility and should increase take-up of its products.”
Chris Neiger, a Nobias 4-star rated analyst who also writes for The Motley Fool, also covered the nearly 10% 2-day pop that the Loop capital upgrade inspires in ROKU shares last week. In his piece, he focused on the surprise upside that the Roku Channel itself was providing to bullish investors.
Neiger said, “Investors might also be bullish on Roku right now after the company said just last week that its new Roku Originals -- its original video content -- have "surpassed our expectations" and that millions of people are already streaming its content.” He continued, writing, “Roku launched 30 original series two weeks ago and plans 45 more this year. The company is tapping into the success of The Roku Channel, which reaches about 70 million U.S. households.”
Advertising revenue that Roku receives from its own channel, as opposed to sales that it receives from third party operators on its platform, are likely to be much higher which has the potential to increase the company’s margins and lead to bottom-line growth. This is paramount to the stock’s long-term success because at the moment, shares trade with a rather speculative, growth oriented valuation.
Roku shares currently trade with a forward price-to-earnings ratio of 1231x. Yes, you read that right, a 4-digit P/E ratio. This is extremely high (the S&P 500’s forward price-to-earnings ratio currently sits in the 22x area). The very high multiple here is due to the fact that ROKU has had a hard time generating positive profits throughout its history. In 2020, for instance, Roku’s earnings-per-share was -$0.14. Yet, 2021 is expected to be the first year that Roku generates positive earnings. Right now, the consensus analyst estimate for the company’s bottom-line is $0.35/share.
Nicholas Ward is a Senior Investment Analyst at Wide Moat Research. He has spent the last 8 years writing about the stock market at various publications, including Seeking Alpha, The Street, Forbes Real Estate Investor, Sure Dividend, The Dividend Kings, iREIT, Safe High Yield, and The Intelligent Dividend Investor.
This positive growth trend is expected to continue in the coming years as well. Right now, analysts expect to see ROKU generate 350% EPS growth in 2021, 161% in 2022, and 145% in 2023. Obviously, these triple digit growth figures draw in growth investors. Yet, for the company’s price-to-earnings multiple to trade in-line with previously mentioned blue chip peers such as Disney or Netflix (which both currently trade for roughly 50x forward expectations) Roku will have to continue on this torrid growth pace for years and years to come.
It’s very speculative to assume that such strong growth will remain in place for a decade or so; however, when we look at the blue chip (4 and 5-star rated) analysts that the Nobias algorithm tracks, it appears that the vast majority of them continue to believe in Roku’s long-term future.
Our algorithm has tracked 4 ratings from highly credibly Wall Street analysts posted during the most recent quarter. 3 out of the 4 of these price targets were bullish. They ranged from $300/share to $450/share and the average price target amongst the group was $379.25.
Roku shares are up 24.66% during the last month alone and it’s important to note that several of these Wall Street reports were published before the stock’s recent rally. The average estimate above implies negative potential from today’s $430 share price and investors should be aware of the valuation risks that come with investing in a speculative name like Roku. However, overall, we’ve tracked out of the 28 reports from other analysts and 27 of them included “Buy” ratings. Therefore, the broader community continues to be bullish on ROKU shares.
Disclosure: Nicholas Ward is long AMZN, CMCSA, and DIS. Nicholas Ward wrote this article for Nobias at their request with a view of giving investors a balanced perspective based on the writings of Nobias highly rated analysts and bloggers. Nobias has no business relationship with any company whose stock is mentioned in this article and does not have a position in this stock.
Additional disclosure: All content is published and provided as an information source for investors capable of making their own investment decisions. None of the information offered should be construed to be advice or a recommendation that any particular security, portfolio of securities, transaction, or investment strategy is suitable for any specific person. The information offered is impersonal and not tailored to the investment needs of any specific person.
Disclaimer: The Nobias star rating is based on past performance results and is not an indicator of future results. These past performance returns do not represent returns that any investor actually earned. Assumptions made include the ability to purchase the stocks recommended by the author under liquid markets where the transaction would be at the market price for the day. In reality, loss in liquidity may have a material impact on the returns that actually may have been earned. Further, returns are calculated without any including transaction costs, management fees, performance fees or expenses, or reinvestment of dividends and other income. This information is provided for illustrative purposes only.
Vertex: Is Vertex Pharmaceuticals A Buy After Recently Hitting 52-Week Lows?
There is a subset of the value investing strategy called GARP-investing, which stands for “growth at a reasonable price”. One of the favorite stocks amongst the cohort of investors/analysts who look for reasonably valued growth names in recent years has been Vertex Pharmaceuticals (VRTX).
Over the last decade VRTX has grown its earnings-per-share from -$3.77/share in 2011 to $10.32/share in 2020. Since posting positive earnings in 2011 ($0.14/share), over the last 9 years, VRTZ has generated an earnings-per-share growth CAGR of 61.25%. And, the consensus analyst estimate for VRTX’s bottom-line growth in the coming years is positive as well, with expectations of 10% earnings growth in 2021, 9% in 2022, and 11% in 2023. And yet, even with these double digit growth figures in mind, Vertex shares trade for just 16.5x 2021 earnings estimates, meaning that VRTX shares trade with a premium that is well below the broader market’s.
The stock has made headlines in recent weeks due to disappointing drug trial results which inspired a double digit sell-off, pushing VRTX down to new 52-week lows. And with that in mind, we wanted to take a look at the recent reports published by Nobias 4 and 5-star rated analysts to see whether or not the strong bullish sentiment that followed this stock earlier in the year was still in place today.

Vertex is a company that focuses on treating rare diseases and is currently the world’s leader in cystic fibrosis (CF) treatment. Todd Campbell, a Nobias 5-star rated analyst, recently published an article on Nasdaq.com which showed the company’s dominance in the CF market.
Campbell wrote, “Vertex Pharmaceuticals is the market share leader in cystic fibrosis treatment; nearly 50% of patients currently being treated for the disease are receiving one of its medications.” He continued saying, “In 2020, Trikafta accounted for 63% of Vertex Pharmaceuticals' $6.2 billion in product revenue, and in the first quarter of 2021, it represented 70% of the company's $1.7 billion in sales.”
To some, this reliance on a single drug is a notable risk; however, Campbell noted that Vertex recently received approval to treat CF patients from the age of 5-12 with Trikafta, therefore opening up an even larger opportunity for the company. He said, “Of the 83,000 cystic fibrosis patients in the U.S., Europe, Australia, and Canada, an estimated 30,000 are untreated, but could be amenable to Trikafta, according to the company.”
According to Campbell, Vertex is also looking to expand the international footprint of its primary drug, seeking “expanded approvals and reimbursement agreements” for Trikafta outside of its current market, which includes the United States and only 12 other countries.
Adria Cimino, a Nobias 4-star rated analyst, recently published an article at The Motley Fool, which also highlighted Vertex’s strong presence in the CF space. She noted that Trikafta “could be an important revenue driver in the coming years because it has the potential to treat more than 90% of all CF patients. Revenue will grow progressively from today as Vertex wins approvals in different countries and age groups.”
Like Campbell, Cimino highlighted Trikafta’s strong sales and cash flows; however, she also touched upon the lack of diversification within Vertex’s product portfolio and revenue stream, saying, “This is all very positive, but investors are concerned about what will happen when increases in CF sales start to slow. At a certain point, Vertex will have reached most potential patients. CF is a rare disease, so once Vertex serves all of today's market, the number of new patients over time will be limited.”
She notes that Vertex’s current pipeline is focused on two particular areas. One of which is “treatments for rare lung and liver disorder alpha-1 antitrypsin deficiency (AATD).” However, it’s important to note that the company has had two major setbacks in this area of its pipeline.
Cimino said, “AATD has spurred Vertex's share-price woes over the past year. The company ended development of one candidate last fall and a second candidate this month, which was the reason for the recent share decline. Vertex said it would bring other AATD candidates into trials next year.”
VRTX shares fell more than 10% on June 11th when news broke that the company abandoned development of candidate VX-864 for AATD. SInce then, they’ve continued to trend lower and trade for $187.70, which is just off of its recent 52-week lows. VRTX has fallen roughly 38.5% from its 52-week high of $306.08 that it set in the summer of 2020. And to some, this share price weakness represents a very strong buying opportunity.
In her piece, Cimino points out that famed growth investor, Cathie Wood of Ark Invest, recently increased her VRTX holdings. Cimino highlighted VRTX’s most recent leg down and said, “That's when Wood moved to increase her Vertex holdings. The stock is among the top 10 holdings in the ARK Genomic Revolution ETF (ARKG).”
Cinimo then went on to say that “Vertex's shares are trading at about 17 times forward earnings estimates. That's the lowest since at least January 2020.” And in her view, “We can expect strong CF revenue from Vertex for several years. Vertex even predicts its CF leadership will last through the late 2030s. The billions in dollars of revenue will fund pipeline programs, and we can add to that Vertex's $6.9 billion in cash. This amount of cash even offers Vertex the possibility to buy a close-to-market candidate at any point.” She concluded her piece in bullish fashion, writing, “Vertex may not deliver big gains this month or even this year.
But investors who favor buying and holding are likely to reap rewards further down the road, so they may be very happy about their decision to follow Cathie Wood.” And, Cimino and Wood aren’t the only two notable investors/analysts who continue to be bullish on VRTX.
In a recent article titled “Move Over, AMC and Dogecoin -- This Stock Could Be a Much Bigger Long-Term Winner” Nobias 5-star rated analyst, Kieth Speights, discusses why, even after the disappointing AATD news, he believes that Vertex can still be a big winner for investors. Regarding Vertex’s portfolio, Speights doesn’t appear to be concerned about the reliance on the CF market. Hsays, “There are currently four approved drugs in the U.S. and Europe that treat the underlying cause of rare genetic disease cystic fibrosis (CF), and Vertex markets all of them. Its newest CF drug, Trikafta/Kaftrio, is its biggest winner yet. The drug is just beginning to pick up momentum in Europe.”
He goes on to note that Vertex does have competition in the CF space; however, the experimental drugs being developed by peers are only in phase-2 tight now and in his view, “Vertex seems likely to dominate the CF market, at least through the next decade.”
Speights says that VRTX continues to innovate in the CF space, attempting to develop treatments which can help the roughly 10% of CF patients that its current portfolio cannot yet help. In the rare disease space, he notes that Vertex “is also developing experimental therapies for other rare diseases, including alpha-1 antitrypsin deficiency, APOL1-mediated kidney diseases, beta-thalassemia, Duchenne muscular dystrophy, and sickle cell disease.” And finally, he says that the company “isn't limiting itself to just rare diseases.” According to Speights, Vertex is also working on treatments for “acute pain following certain types of surgues” and those drugs are currently in phase-2 trials. He goes on to say, “The important thing to note is that Vertex doesn't need all of these programs to be successful. If only one or two of them pan out, this biotech stock should deliver tremendous returns.”
However, with all of this bullish sentiment in mind, it’s important to consider the downside risks as well. Zhiyuan Sun, a Nobias 4-star rated analyst, recently published a bearish piece on Nasdaq.com, which highlights investor concerns about VRTX’s forward growth prospects. Sun highlighted the company’s recent AATD failures and then said, “That leaves just CTX001, a gene therapy for treating hereditary blood disorders, as its leading pipeline candidate. However, Vertex is developing the transfusion therapy jointly with CRISPR Therapeutics (NASDAQ: CRSP). In addition to profit-sharing agreements, Vertex already paid the latter $900 million up front to jointly develop the technology. So even after approval, it has a long way to go to break even.” He goes on to highlight Trikafta’s “staggering cost of $311,000 per year” pointing out that at this level, the company is likely going to have a hard time expanding outside of development markets (which it already has strong exposure to).
Nicholas Ward is a Senior Investment Analyst at Wide Moat Research. He has spent the last 8 years writing about the stock market at various publications, including Seeking Alpha, The Street, Forbes Real Estate Investor, Sure Dividend, The Dividend Kings, iREIT, Safe High Yield, and The Intelligent Dividend Investor.
Sun wrote, “There are only about 83,000 CF patients in developed countries. Nearly half of them are already taking Vertex medications. It's safe to say that the company has hit a brick wall in terms of generating prescription volume due to its pricing.” He also noted the recent slowdown of both sales and earnings, showing that VRTX produced sales growth of 14% and net income growth of 16% during the first quarter of this year, which is much lower than the 77% revenue growth and 128% earnings growth that the company generated on a year-over-year basis just one year ago.
Sun concluded his piece saying, “Without the launch of new pipeline candidates, it can't sustain those valuation levels. I think there is more struggle to come for its shares. It's best to avoid biotech for the time being.” Overall, Sun appears to be in a stark minority when looking at the 4 and 5-star rated Nobias analysts, however.
During the last 2 months, our algorithm has tracked 27 reports published by such highly ranked individuals and 26 of them came with “Buy” ratings attached. Since the June 11th news regarding the poor AATD trial results, we’ve seen 7 blue chip analysts (4 and 5-star rated) update their price targets for VRTX shares. These targets ranged from $200-$285 with an average of $256.29. Being that VRTX shares currently trade for $187.70, this average price target implies upside potential of approximately 36.5%.
Disclosure: Nicholas Ward had no VRTX position as of writing this article on 6/22/2021 but may initiate exposure during the next 72-hours. . Nicholas Ward wrote this article for Nobias at their request with a view of giving investors a balanced perspective based on the writings of Nobias highly rated analysts and bloggers. Nobias has no business relationship with any company whose stock is mentioned in this article and does not have a position in this stock.
Additional disclosure: All content is published and provided as an information source for investors capable of making their own investment decisions. None of the information offered should be construed to be advice or a recommendation that any particular security, portfolio of securities, transaction, or investment strategy is suitable for any specific person. The information offered is impersonal and not tailored to the investment needs of any specific person.
Disclaimer: The Nobias star rating is based on past performance results and is not an indicator of future results. These past performance returns do not represent returns that any investor actually earned. Assumptions made include the ability to purchase the stocks recommended by the author under liquid markets where the transaction would be at the market price for the day. In reality, loss in liquidity may have a material impact on the returns that actually may have been earned. Further, returns are calculated without any including transaction costs, management fees, performance fees or expenses, or reinvestment of dividends and other income. This information is provided for illustrative purposes only.