
TSLA with Nobias Technology: Case Study on Tesla
The Nasdaq just posted a strong weekly performance of +2.26%; however, Tesla (TSLA) shares posted even bigger gains, up 9.48% during the last 5 trading sessions. This was welcomed news for TSLA bulls after the roughly 38% year-to-date losses that Tesla had posted coming into its recent second quarter report.
The Nasdaq just posted a strong weekly performance of +2.26%; however, Tesla (TSLA) shares posted even bigger gains, up 9.48% during the last 5 trading sessions. This was welcomed news for TSLA bulls after the roughly 38% year-to-date losses that Tesla had posted coming into its recent second quarter report.
Tesla reported earnings on Wednesday, Jule 20th, meeting Wall Street’s expectations on the top-line, posting quarterly revenue of $16.93 billion, up 41.6% on a year-over-year basis, and exceeding expectations on the bottom-line, with non-GAAP earnings-per-share coming in at $2.27/share, $0.47/share above the consensus analyst estimate. These Q2 results inspired a late-week rally, sending shares nearly 10% higher from the $745 area up to their current share price of $816.73.
According to coverage from Kevin. P. Curran, a Seeking Alpha news editor, this rally caused investors who were short Tesla coming into the quarter to lose more than a billion dollars in total. Regarding the aggregate position of TSLA short sellers, Curran highlighted work performed by Ihor Dusaniwsky, Head of Predictive Analytics at data and predictive analytics firm S3 Partners, who noted “that while short sellers were “actively trimming” exposure into the quarter by covering over 2M shares, total short interest remained at just over $18.5B heading into the report.”

TSLA Jul 2022
Dusaniwsky continued, “We should expect its short covering trend to continue as short sellers get squeezed out of their positions due to these large and sudden losses. These buy-to-covers and the potential for hedge funds to bulk up their positions in a high beta name with a positive price trend may help reverse TSLA’s year price weakness.”
Howard Smith, a Nobias 4-star rated author, covered Tesla’s earnings results in an article at The Motley Fool. Smith wrote, “Tesla earned $1.95 per share for the quarter from sales of $16.9 billion. While that was down from first-quarter revenue of $18.8 billion, it still represented a jump of 42% year over year. And both top- and bottom-line results beat analyst expectations of $1.81 per share and $16.5 billion, respectively.” He continued, “Investors already knew the second quarter was challenging, with COVID-19 delays at its Shanghai plant and supply chain issues hampering the ramp-up of its two new plants. But Tesla's original guidance of 50% annual production growth still remains doable, which boosted investor confidence after the stock was down more than 30% year to date heading into the report.”
Smith highlighted Tesla’s improving balance sheet, writing, “The company ended the quarter with $18.9 billion in cash, cash equivalents, and marketable securities. The cash position grew thanks to more than $600 million in free cash flow.” Ultimately, he concluded, “That's the sign of a healthy business.”
With regard to the health of Tesla’s business, Shrilekha Pethe, a Nobias 5-star rated author, broke down the company’s automotive producing numbers during Q2 in a recent report. Pethe said, “In Q2, TSLA produced 258,580 cars, which increased 25% year-over-year. It delivered 254,695 cars, up 27% year-over-year.
Pethe continued, “By the top-rated analyst’s estimate, the company’s installed annual production capacity is currently at more than 1.9 million vehicles, with production likely to reach approximately 40,000 per week by the end of this year.”
Pethe acknowledged Tesla’s post-earnings rally; however, she offered a bit of caution to bullsh investors during the conclusion of her piece, stating, “While Tesla seems to be riding through the current challenging macro environment well, it remains to be seen how it measures up if the current economic slowdown continues.”
Marty Shtrubel, a Nobias 4-star rated author, also noted a potential concern coming out of Tesla’s second quarter results in a recent article at Nasdaq.com, stating, “One area of concern, however, was noted in the margin profile, which suffered at the hands of rising inflation and stiff competition for EV parts. Margins contracted to 27.9%, below the impressive 32.9% reported in Q1 and the 28.4% delivered during the same period last year. The margin drop was linked to the costs associated with the ramping of the new facilities in Austin and Berlin.”
It appears that Morgan Stanley analyst, Adam Jonas, shares these concerns. In his piece, Shtrubel wrote, “Surveying the results, Morgan Stanley’s Adam Jonas notes that demand is still outstripping supply. Although with the “new challenges” on account of the ramping of production - especially in Berlin - the analyst is readying for further “near-term margin headwinds.”’
However ultimately, Jonas remains a Tesla bull. Jonas touched upon Tesla’s valuation in his note, saying, “In the interim, we have a stock trading at approx 20x EBITDA and 35x our current FY25 forecasts… multiples that many auto investors are likely to find unacceptably high but tech investors may find attractive…” Shtrubel stated, “Jonas seems to find those multiples acceptable. The analyst reiterated an Overweight (i.e., Buy) rating along with a $1,150 price target, implying room for share appreciation of 41% over the coming year.”
Overall, on July 22, 2022 Shtrubel said that the average price target for TSLA shares on Wall Street was $886.04. Therefore, he acknowledged that the majority of Wall Street analysts agree with Jonas’ bullish take, saying, “Most are backing TSLA’s continued success, but there are voices heeding caution; the stock’s Moderate Buy consensus rating is based on 17 Buys, 5 Holds and 7 Sells. Going by the $886.04 average target, shares are expected to climb a modest 9% over the one-year timeframe.”
One such Wall Street TSLA bull is Gene Munster of Loup Funds. In the wake of TSLA’s Q2 report, Shanthi Rexaline, a Nobias 4-star rated author, highlighted analysis provided by “Noted Tesla analyst and Loup Fund co-founder Gene Munster”.
Rexaline broke down Munster’s post-earnings analysis, listing his “Key Earnings Call Takeaways”. Rexaline wrote:
Musk reaffirmed that the broader rollout of the full-self-driving feature is on track this year. Munster is of the view the recent departure of Tesla’s ex-AI executive Andrej Karpathy isn’t a measurable headwind to the timing of the FSD release, given the company has a team of 120 people in the software AI group.
The Tesla CEO also said in his prepared remarks that FSD users now number 100,000. Munster said this is ahead of his estimate of 50,000.
The company announced that AI Day 2.0 is being pushed from August to either September or October. The shift, according to the Loup analyst, is due to Karpathy leaving.
Tesla CFO Zach Kirkhorn said the delivery growth target of 50% is difficult but doable. Kirkhorn also hinted at margin pressure due to the ramp of the Giga factories in Austin and Berlin.
Musk mentioned carbon, steel, and aluminum prices are falling. Munster expects this to positively impact margins in early 2023.

Nicholas Ward is a Senior Investment Analyst at Wide Moat Research. He has spent the last 8 years writing about the stock market at various publications, including Seeking Alpha, The Street, Forbes Real Estate Investor, Sure Dividend, The Dividend Kings, iREIT, Safe High Yield, and The Intelligent Dividend Investor.
Looking at the credible Wall Street analysts that Nobias tracks, we see that the average price target being applied to TSLA shares by the individuals with 4 and 5-star Nobias ratings is even higher than Wall Street’s consensus opinion.
Right now, the average TSLA price target amongst this cohort of credible individuals is $928. Relative to TSLA’s current price of $891, that presents an upside potential of approximately 6%. However, the credible authors that the Nobias algorithm tracks (once again, only individuals with 4 and 5-star Nobias ratings) remain largely bearish on TSLA shares. 90% of recent articles published by credible authors have expressed a “Bearish” bias towards TSLA shares.
Tesla has been a very volatile stock throughout 2022 and with this disconnect between the author and the analyst communities tracked by the Nobias algorithm in mind, it’s likely that this trend continues as the game of tug-of-war between the bulls and the bears on this $845 billion company continues to play itself out.
Disclosure: Nicholas Ward has no TSLA position. Nicholas Ward wrote this article for Nobias at their request with a view of giving investors a balanced perspective based on the writings of Nobias highly rated analysts and bloggers. Nobias has no business relationship with any company whose stock is mentioned in this article and does not have a position in this stock.
Additional disclosure: All content is published and provided as an information source for investors capable of making their own investment decisions. None of the information offered should be construed to be advice or a recommendation that any particular security, portfolio of securities, transaction, or investment strategy is suitable for any specific person. The information offered is impersonal and not tailored to the investment needs of any specific person.
Disclaimer: The Nobias star rating is based on past performance results and is not an indicator of future results. These past performance returns do not represent returns that any investor actually earned. Assumptions made include the ability to purchase the stocks recommended by the author under liquid markets where the transaction would be at the market price for the day. In reality, loss in liquidity may have a material impact on the returns that actually may have been earned. Further, returns are calculated without any including transaction costs, management fees, performance fees or expenses, or reinvestment of dividends and other income. This information is provided for illustrative purposes only.
NFLX with Nobias Technology: Case Study on Netflix
After hitting all-time highs of $700.99/share in late 2021, Netflix has experienced a tumultuous first half of the year thus far during 2022, posting -62.2% losses on a year-to-date basis. Netflix struggled during the first several months of the year, due in large part to the risk-off trade that hurt many of the popular growth stocks in the market; however, the pace of its 2022 sell-off accelerated after the company’s first quarter report.
After hitting all-time highs of $700.99/share in late 2021, Netflix has experienced a tumultuous first half of the year thus far during 2022, posting -62.2% losses on a year-to-date basis. Netflix struggled during the first several months of the year, due in large part to the risk-off trade that hurt many of the popular growth stocks in the market; however, the pace of its 2022 sell-off accelerated after the company’s first quarter report.
During Q1, Netflix posted its first year-over-year subscriber loss number in more than a decade. Coming into the first quarter print, the company’s guidance called for approximately 2.5 million additional subs. When the official numbers were published, Wall Street was taken aback by a net loss of 200,000 subscribers, causing NFLX shares to fall by more than 20% in the after hours.
That negative momentum remained throughout the rest of the quarter, with NFLX falling from nearly $350/share on April 19th (when the Q1 numbers were released) to 52-week lows of $162.71/share (which the stock hit on 5/12/2022).
Since hitting those lows, Netflix shares have traded in a fairly right range, in the $175-$200 range. However, in recent days the stock has rallied, up more than 15% during the last week alone, due to Q2 results which appeased investors and removed some of the negative sentiment surrounding the stock.

NFLX Jul 2022
Regarding Netflix’s recent sell-off, Nobias 4-star rated author, Stjepan Kalinic, said, “Few large companies experienced a fall from grace with a higher velocity than Netflix, Inc., as it cratered over 70% year to date. Now, the stock is showing signs of bottoming, supported by the fact that the latest results were not as bad as expected.”
In the recent post-earnings article that Kalinic posted at Simply Wall Street, he discussed ongoing headwinds for the company, due to the thesis that over-the-top content streaming has peaked, writing, “For the first time, the company lost subscribers for 2 quarters in a row. It seems that the streaming market has reached its zenith, with the average household signed up to 4.7 services.”
Looking forward, Kalinic appears to be bearish on the company’s ability to return to growth. He stated, “Considering that some of the most popular series like Stranger Things and Ozark ended, the company doesn't have standout content coming out to boost the Q3 numbers.”
Another concern that Kalinic mentioned was rising content costs. He noted that NFLX’s content costs rose by “almost 20% Y/Y” during Q2 and this is having a negative impact on the company’s balance sheet. Kalinic said, “According to the last reported balance sheet, Netflix had liabilities of US$7.74b due within 12 months and liabilities of US$20.0b due beyond 12 months. On the other hand, it had cash of US$6.01b and US$824.7m worth of receivables due within a year. So it has liabilities totaling US$21.0b more than its cash and near-term receivables combined. This deficit isn't bad because, despite the recent crash, Netflix still has a market capitalization of about US$89b. Thus, it could raise enough capital to shore up its balance sheet if needed.”
Kalinic does go on to note that, “Netflix has net debt of just 1.3 times EBITDA, indicating that it is undoubtedly not a reckless borrower.” However, he continues, “Over the last three years, Netflix recorded negative free cash flow in total. Debt is usually more expensive and almost always riskier in the hands of a company with negative free cash flow.”
Concluding his piece, Kalinic wrote, “The most recent results were not as bad as anticipated. However, they're still not great - the company lost another 1 million subscribers as it looks like the streaming wars have saturated the market.” He also cautioned investors, noting, “While we appreciate debt can enhance returns on equity, we'd suggest that shareholders keep a close watch on its debt levels lest they increase.”
Stephen Guilfoyle, a Nobias 4-star rated author, also recently wrote a post-earnings update on Netflix shares at The Street. Guilfoyle dove into the Q2 data, writing, “For the three month period ending June 30th, Netflix posted GAAP EPS of $3.20, handily beating Wall Street's expectations, on revenue of $7.97B. The sales number was good enough for year over year growth of 8.6% (13% in constant currency), but not good enough to beat consensus view. Operating income of $1.578B was down 14.6% versus the comparable year ago quarter. Operating margin dropped from 25.2% for Q2 2021 to 19.8%.”
Regarding Q2 subs, Guilfoyle said, “Global streaming paid memberships contracted by a rough 970K subscribers to 220.67M.” Netflix rallied on this ~1 million sub loss, because, in large part, Guilfoyle notes, previous guidance calling for losses of 2 million subs or more.
In other words, Netflix set a very low bar for itself to clear during the quarter. Guilfoyle noted that the stock’s “euphoric response to a number that would have been seen as tragic had the firm not provided such a low bar.”
Guilfoyle continued, breaking down Netflix’s regional performance, stating:
“UCAN (US/Canada) drove $3.538B in revenue (+9.4%), as paid memberships contracted to 73.28M (-0.1%). Average revenue per membership increased to $15.95.
EMEA (Europe, Middle East & Africa) drove $2.457B in revenue (-2.4%), as paid memberships increased to 72.97M (+6.2%). Average revenue per membership decreased to $11.17.
LATAM (Latin America) drove $1.03B in revenue (+19.6%), as paid memberships increased to 39.62M (+2.5%). Average revenue per membership increased to $8.67.
APAC (Asia Pacific) drove $908M in revenue (+13.6%), as paid memberships increased to 34.8M (+22.2%). Average revenue per membership decreased to $8.83.”
Looking ahead at Q3 expectations, Guilfoyle touched upon NFLX’s most recent guidance, stating, “For the current quarter, Netflix sees revenue of $7.838B and diluted EPS of $2.14. Wall Street had been up at revenue of $8.1B and EPS of $2.77 on these metrics.”
However, even though NFLX is guiding for a return to subscriber growth (management is now calling for 1 million+ new net subs during Q3), Guilfoyle is not bullish on the news because “operating margin is expected to sink from Q2's 19.8% to 16.0%.”
He concluded his bearish piece, stating, “I see a problem that I don't think is being spoken of. Netflix still lost a lot of paying customers. A lot of these subscriber losses were in North America. A lot of those folks pay their bills in U.S. dollars. Growth elsewhere, among subscribers paying their bills in their home currency is not a one for one exchange with a lost sub who pays in greenbacks. The outlook bothers me too. Who cares if you add a million subs if doing so crushes margin and pressures earnings?”
Since NFLX’s earnings were posted, a slew of Wall Street analysts have updated their opinions on the stock. Georg Szalai, a Nobias 4-star rated author covered several of these recent analyst notes in an article he published at The Hollywood Reporter.
Szalai highlighted a recent note from Credit Suisse analyst Douglas Mitchelson, a Nobias 4-star rated analyst, who reduced his price target on NFLX shares from $360 to 263, “due to a more conservative long-term forecast.”
Mitchelson said, “Uncertainty remains elevated for Netflix with subscriber growth stalled post-pandemic and (management) focusing on improving monetization via charging for password sharing and broadening the service’s value proposition through lower-priced ad tiers.”
Szalai noted that Mitchelson acknowledged that he “sees some promise” in NFLX’s new endeavors, ultimately, the analyst concluded that they “will take at least well into 2023 to prove out (and perhaps into 2024 to drive meaningful revenue reaccelerating).”
Szalai put a spotlight on a more bullish take from Guggenheim’s Michael Morris, a Nobias 4-star rated analyst, who said, “Key opportunities in advertising and password sharing are taking shape, though still early. Notably, the company’s ambitious pursuit comes with spend discipline, with annual cash content spend of around $17 billion in ‘the right ZIP code’ for the next several years.” Morris maintained his “buy” rating no NFLX shares, with a $265 price target. Morris concluded his note stating, “We continue to see attractive value and optionality in Netflix shares.”
Nicholas Ward is a Senior Investment Analyst at Wide Moat Research. He has spent the last 8 years writing about the stock market at various publications, including Seeking Alpha, The Street, Forbes Real Estate Investor, Sure Dividend, The Dividend Kings, iREIT, Safe High Yield, and The Intelligent Dividend Investor.
Chris Morris, a Nobias 4-star rated author, also provided cause for optimism for NFLX bulls, penning a piece at Yahoo Finance which highlighted merger activity that was recently announced. He wrote, “Netflix announced Tuesday it plans to acquire Animal Logic, the animation studio behind such hits as The Lego Movie and Happy Feet. It’s an extension of a previous relationship between the two companies, which had previously worked together on Klaus and The Sea Beast, which are Netflix exclusives.”
Chris Morris continued, “The move, which is expected to close later this year, would give Netflix more ownership of its catalog, something critics of the brand have called out as a weakness when compared to other streaming houses, such as Disney+ or HBO Max.”
Overall, the Nobias algorithm is still seeing a very bearish lean amongst the credible authors that we track (only those with 4 and 5-star Nobias ratings). 72% of recent articles published by such authors have included a “Bearish” bias.
The credible Wall Street analysts that we track are more bullish, however. Right now, the average price target that the credible analysts that the Nobias algorithm tracks (once again, only those with 4 and 5-star ratings) is $238.70. After its post-earnings rally, NFLX shares trade for $223.88. Therefore, that average price target implies further upside potential of approximately 6.6%.
Disclosure: Nicholas Ward is long NFLX. Nicholas Ward wrote this article for Nobias at their request with a view of giving investors a balanced perspective based on the writings of Nobias highly rated analysts and bloggers. Nobias has no business relationship with any company whose stock is mentioned in this article and does not have a position in this stock.
Additional disclosure: All content is published and provided as an information source for investors capable of making their own investment decisions. None of the information offered should be construed to be advice or a recommendation that any particular security, portfolio of securities, transaction, or investment strategy is suitable for any specific person. The information offered is impersonal and not tailored to the investment needs of any specific person.
Disclaimer: The Nobias star rating is based on past performance results and is not an indicator of future results. These past performance returns do not represent returns that any investor actually earned. Assumptions made include the ability to purchase the stocks recommended by the author under liquid markets where the transaction would be at the market price for the day. In reality, loss in liquidity may have a material impact on the returns that actually may have been earned. Further, returns are calculated without any including transaction costs, management fees, performance fees or expenses, or reinvestment of dividends and other income. This information is provided for illustrative purposes only.
UNH with Nobias Technology: Case Study on United Healthcare
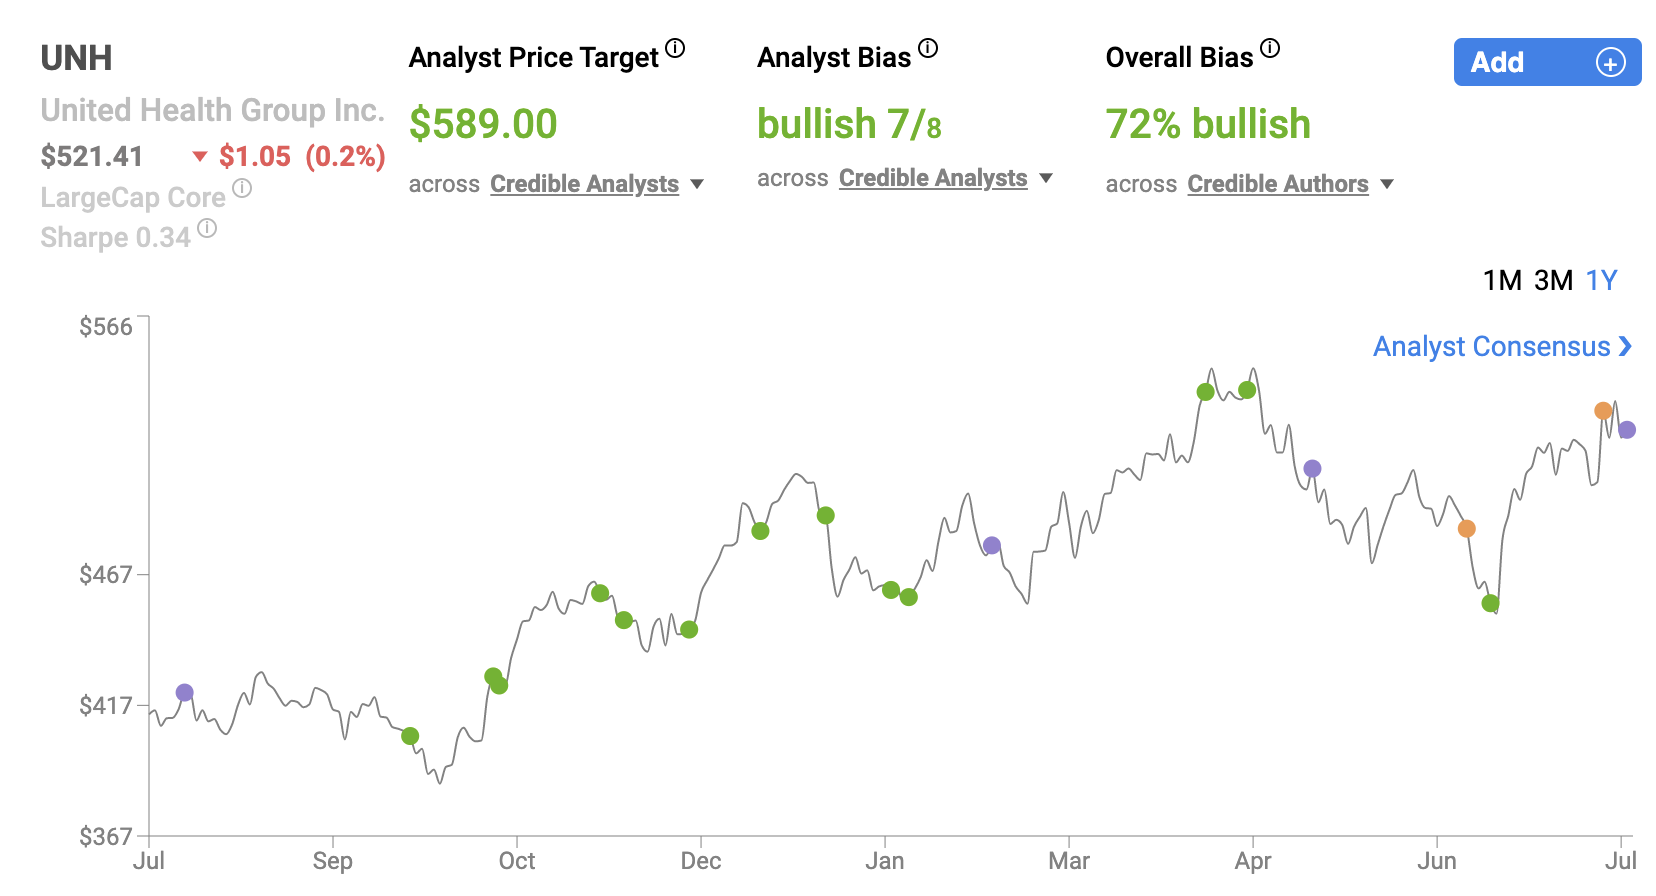
United Healthcare reported earnings on Friday of last week. It was the first major insurance company to do so. The company continued its trend of beating Wall Street estimates and rallied into the end of the week. UNH shares were up by 3.02% on the week, pushing its year-to-date gains up to 5.47%. This means that UNH is a major out-performer on a year-to-date basis (the S&P 500 is down by 19.46% during 2022 thus far). And yet, even with this relative year-to-date outperformance in mind, credible analysts are still bullish on UNH moving forward, projecting double digit upside potential.
United Healthcare reported earnings on Friday of last week. It was the first major insurance company to do so. The company continued its trend of beating Wall Street estimates and rallied into the end of the week. UNH shares were up by 3.02% on the week, pushing its year-to-date gains up to 5.47%. This means that UNH is a major out-performer on a year-to-date basis (the S&P 500 is down by 19.46% during 2022 thus far). And yet, even with this relative year-to-date outperformance in mind, credible analysts are still bullish on UNH moving forward, projecting double digit upside potential.
Jonathan Block, a Nobias 4-star rated author, recently highlighted the importance of Unitedhealth earnings in a Seeking Alpha report, writing, “UnitedHealth's results are closely looked at by investors as they are seen as a bellwether for the rest of the industry. The company is the largest health insurer based on membership.”
Block’s report stated, “UnitedHealth has a history of beating analyst estimates going back at least to Q2 2017.” Block said, “As COVID-19 continues to have less of a daily impact, one statistic in earnings releases to pay attention to is change in the medical loss ratio ("MLR").” He continued, “During the height of the pandemic, many doctor visits and procedures were put off, allowing the MLR to fall for many insurers. This helped the bottom line.”
UNH Jul 2022
However, Block stated, “There are already signs MLRs are rising. In its Q1 results, the MLR was 82%, up from 80.9% in the year-ago period.” Yet, despite these rising MLR figures, Block noted that UNH management increased its full-year guidance after a bullish Q1 report (where the company beat Wall Street’s estimates on both the top and bottom lines).
Back in mid-April, the company stated, “Based upon the first quarter performance and enterprise-wide growth outlook, the Company increased its full year net earnings outlook to $20.30 to $20.80 per share and adjusted net earnings to $21.20 to $21.70 per share.” Coming into UNH’s second quarter report, Block noted, “For Q2 2022, analysts are expecting GAAP EPS of $4.99 and revenue of $79.68B.”
Damian J. Troise, a Nobias 4-star rated author, collaborated on a macro write-up published at MarketBeat on Friday, which highlighted consumer sentiment data, alongside several prominent earnings reports (including UnitedHealthcare’s), which sent the market higher into the weekend.
Troise wrote, “Stocks are broadly higher in afternoon trading on Wall Street Friday following an encouraging report on consumer sentiment and inflation expectations.” His report stated, “Wall Street has been worried that the Fed could go too far in raising rates and actually bring on a recession. Investors have been closely watching economic reports for clues as to how the central bank might react and the latest upbeat consumer sentiment report raises the chance of the Fed softening its current policy.”
Troise said, “A July survey from the University of Michigan showed that inflation expectations have held steady or improved, along with general consumer sentiment. It was a welcome update following several government reports this week that showed consumer prices remained extremely hot in June, along with wholesale prices for businesses.”
Thinking about market impact, Troise wrote, “The report also bodes well for investors looking for signs that the Federal Reserve might eventually ease off its aggressive policy to fight inflation.” And looking at the ticker specific action on Friday, he said, “Technology stocks, banks and healthcare companies made some of the biggest gains.”
With specific regard to UNH, Troise stated, “UnitedHealth Group rose 5% after raising its profit forecast for the year following a strong earnings report.” When UnitedHealthcare reported Q2 earnings on July 15th, 2022, the company once again beat Wall Street’s consensus expectations on the top and bottom lines.
UNH produced quarterly revenue of $80.3 billion during Q2, beating the consensus estimate by $620 million, and representing 12.6% year-over-year growth. UnitedHealthcare’s non-GAAP earnings-per-share came in at $5.57/share, beating estimates by $0.37/share. The company stated that “Earnings from Operations were $7.1 Billion, Growth of 19% Year-Over-Year”. UNH’s “Cash Flows from Operations were $6.9 Billion, 1.3x Net Income”.
Andrew Witty, chief executive officer of UnitedHealth Group, said, “Customers are responding as we build on our five growth pillars, enabling us to move into the second half of 2022 with strong momentum serving ever more people more deeply.”
The company highlighted the overall scope of its business, stating: “Total people served by UnitedHealthcare has grown by over 600,000 in 2022, including 280,000 in the second quarter. Growth was led by UnitedHealthcare’s community-based and senior offerings. The number of people served with domestic commercial benefit offerings has grown by over 250,000 over the past year, including 80,000 in the second quarter.”
UnitedHealthcare touched upon its medical care ratio, stating: “The second quarter 2022 medical care ratio was 81.5% compared to 82.8% last year, due to COVID effects and business mix. Favorable medical reserve development of $890 million compared to $500 million in the year ago second quarter. Days claims payable were 50.6, compared to 49.1 in the first quarter of 2022 and the second quarter of 2021.”
And, once again, UNH raised full-year bottom-line guidance, stating: “Based upon the first half performance and growth expectations, the company increased its full year net earnings outlook to $20.45 to $20.95 per share and adjusted net earnings to $21.40 to $21.90 per share. Growth in the second quarter was balanced across the company’s businesses, driven especially by continued strong expansion in people served at UnitedHealthcare and in value-based arrangements at Optum Health.”
Nicholas Ward is a Senior Investment Analyst at Wide Moat Research. He has spent the last 8 years writing about the stock market at various publications, including Seeking Alpha, The Street, Forbes Real Estate Investor, Sure Dividend, The Dividend Kings, iREIT, Safe High Yield, and The Intelligent Dividend Investor.
After UNH’s Q2 results were posted, John Reese, a Nobias 5-star rated author, published an article at Nasdaq.com which put a spotlight on UNH as a company which was recently upgraded via “Validea's Patient Investor model based on the published strategy of Warren Buffett.”
Reese stated, “This strategy seeks out firms with long-term, predictable profitability and low debt that trade at reasonable valuations.” Regarding UNH and the Validea Patient Investor model, Reese said, “The rating according to our strategy based on Warren Buffett changed from 86% to 93% based on the firm’s underlying fundamentals and the stock’s valuation.”
To put this into perspective, he continued, “A score of 80% or above typically indicates that the strategy has some interest in the stock and a score above 90% typically indicates strong interest.” Looking at the data collected by the Nobias algorithm, it appears that the consensus amongst the credible authors and Wall Street analysts that we track agree with the Validea outlook.
95% of recent articles on UNH published by credible authors (only those with Nobias 4 and 5-star ratings) have expressed a “Bullish” bias on the stock. Right now, the average price target being applied to UNH shares by the credible Wall Street analysts that we track (once again, only those with 4 and 5-star Nobias ratings) is $588.63. Today, UNH shares trade for $529.75. Therefore, that average price target implies upside potential of 11.1%.
Disclosure: As of 7/17/2022, Nicholas Ward had no position in UNH. Nicholas Ward wrote this article for Nobias at their request with a view of giving investors a balanced perspective based on the writings of Nobias highly rated analysts and bloggers. Nobias has no business relationship with any company whose stock is mentioned in this article and does not have a position in this stock.
Additional disclosure: All content is published and provided as an information source for investors capable of making their own investment decisions. None of the information offered should be construed to be advice or a recommendation that any particular security, portfolio of securities, transaction, or investment strategy is suitable for any specific person. The information offered is impersonal and not tailored to the investment needs of any specific person.
Disclaimer: The Nobias star rating is based on past performance results and is not an indicator of future results. These past performance returns do not represent returns that any investor actually earned. Assumptions made include the ability to purchase the stocks recommended by the author under liquid markets where the transaction would be at the market price for the day. In reality, loss in liquidity may have a material impact on the returns that actually may have been earned. Further, returns are calculated without any including transaction costs, management fees, performance fees or expenses, or reinvestment of dividends and other income. This information is provided for illustrative purposes only.
JPM with Nobias Technology: Case Study on JP Morgan
J.P. Morgan (JPM) reported its second quarter earnings on Thursday, July 14th, missing Wall Street consensus estimates on both the top and bottom lines. The company posted revenues of $30.7 billion, which were $1.12 billion lower than consensus. JPM’s GAAP earnings-per-share totaled $2.76, which was $0.13/share below Wall Street’s average target.
J.P. Morgan (JPM) reported its second quarter earnings on Thursday, July 14th, missing Wall Street consensus estimates on both the top and bottom lines. The company posted revenues of $30.7 billion, which were $1.12 billion lower than consensus. JPM’s GAAP earnings-per-share totaled $2.76, which was $0.13/share below Wall Street’s average target.
Nobias 5-star rated author, AJ Fabino, covered the company’s quarterly report in an article at Benzinga, stating, “Shares of JPMorgan fell to a new 52-week low on Thursday following the release of the report, falling 4.10% to $107.31 in the morning; here are more details.”
Regarding the company’s press release, Fabino quoted JPMorgan CEO Jamie Dimon who said, “Geopolitical tension, high inflation, waning consumer confidence, the uncertainty about how high rates have to go, and the never-before-seen quantitative tightening and their effects on global liquidity, combined with the war in Ukraine and its harmful effect on global energy and food prices are very likely to have negative consequences on the global economy sometime down the road.” This bearish sentiment from management came after the company produced relatively poor bottom-line results.

JPM Jul 2022
Fabino stated, “Net income (profits) came in at $8.6 billion: Down 28% in the same period last year, predominantly driven by a net credit reserve build of $428 million.” In light of the negative profit growth, JPM management decided to reduce shareholder returns. Once again, Fabino quoted Dimon, who said, “We have temporarily suspended share buybacks which will allow us maximum flexibility to best serve our customers, clients, and community through a broad range of economic environments.”
Moving forward, Fabino noted, “The capital that would’ve been used in the share repurchase program will be shifted to help the company reach its regulatory capital requirements.” In short, because of macro concerns and ongoing global headwinds, J.P. Morgan is preparing for an even deeper economic slowdown.
Despite Dimon’s relatively cautious remarks which spooked many investors across Wall Street, after JPM’s Q2 earnings were announced, Nobias 4-star rated author, Stjepan Kalinic, published a report at Simply Wall Street which expressed bullish sentiment, largely due to the stock’s low valuation.
Kalinic highlighted some of the cautious commentary from JPM management during the quarterly release, stating, “In recent months, CEO Jamie Dimon has been rather vocal about a potential recession incoming, pointing out geopolitical and economic challenges of high inflation, supply chain issues, and geopolitical conflicts. Yet, he remains optimistic about handling the recession, noting that the consumers are in relatively good shape – spending money and having access to a strong labor market.” He continued, “While CEO Jamie Dimon remains optimistic about the bank's capabilities to navigate through a (potential) recession – the bank is already taking preventive actions, the first among them being a suspension of stock buybacks.”
On the subject of buyback suspensions, Kalinic noted that investors should be grateful that JPM continues to provide shareholder returns in the form of a quarterly dividend. He wrote, “Given the recent stress test results, a decision to suspend the buyback isn't surprising, but the good news is that the bank won't cut the dividend.”
Looking at the quarterly results, Kalinic highlighted a slew of fundamental metrics:
Revenue: US$31.6b, +1% Y/
Net income: US$8.64b (US$2.76 per share): -28% Y/
Credit costs: US$1.1b (US$428m net reserve build, US$657m net charge-offs
Average deposits: +9
Average loans: +7%
He then stated, “The Consumer Banking arm was the biggest loser, with net income declining 45% Y/Y. On the other hand, Asset & Wealth Management arm declined "just" 13% Y/Y.”
Regarding JPM’s fundamental growth, Kalinic stated, “Recent times haven't been advantageous for JPMorgan Chase as its earnings have risen slower than most other companies. A Low P/E of 7.8x is probably low because investors think this lackluster earnings performance will not get any better.” But, he notes that these subpar earnings results haven’t always been the case for this stock.
Kalinic wrote, “Looking back, the company grew earnings per share by 7.1% last year. This was backed up by an excellent period before seeing EPS up by 48% in total in the previous three years. Therefore, it's fair to say the earnings growth recently has been superb for the company, yet - over the last 10 years, JPMorgan stock has lagged the S&P500 increase.”
Overall, after looking at all of the quarterly data and JPM’s current valuation, Kalinic concluded, “At the moment, JPM trades at an attractive valuation. Still, its attractiveness remains mainly a question of whether an investor is comfortable with high exposure to the investment banking segment, which seems to be heading for more challenging times.”
Yet, in recent days we’ve seen another credible Nobias author publish a post-earnings report which came to a different, much more bearish conclusion. In a recent article published at Seeking Alpha, Nobias 4-star rated author, Cory Cramer, highlighted the highly cyclical nature of J.P. Morgan’s earnings and established a bearish price target for JPM shares using historical data.
Cramer said, “The rough earnings growth decline threshold I use to declare a business either "deep cyclical" or "less-cyclical" is -50%. This level can actually vary quite a lot from bank to bank, depending on what kind of bank it is and their loan practices or whether they are an investment bank or a traditional bank. In the end, all I care about are their historical earnings patterns. In JPM's case, because of the -69% decline in earnings growth in 2008, combined with various other years of double-digit earnings growth declines, I would classify JPM stock as a "deep cyclical" stock.” He noted that, “Obviously, JPM has changed over the decades and it is not the same company it was in the 1970s or 1980s, but I find it's always useful to start with a big picture view first so that we have some idea of what is possible.”
Looking at past data, Cramer said, “During the big downcyles it is typical for JPM's stock price to fall about -70% off its highs. This happened during the 1987, 2000, and 2007 downcycles. I think it's reasonable, most other things being equal, to be prepared for the stock to fall that far if we have a bad recession this downcycle.”
When attempting to find connections between the past and the bear market that investors are witnessing today, Cramer stated, “Generally speaking, I think the 2000 stock market decline has the most in common with our current decline. But I think JPM was about 20% more overvalued at the 2000 peak than it was at the 2021 peak based on their peak pre-recession P/E ratios.”
Nicholas Ward is a Senior Investment Analyst at Wide Moat Research. He has spent the last 8 years writing about the stock market at various publications, including Seeking Alpha, The Street, Forbes Real Estate Investor, Sure Dividend, The Dividend Kings, iREIT, Safe High Yield, and The Intelligent Dividend Investor.
However, he noted that JPM’s valuation was more attractive at the start of the recent drawdown than it was prior to the dot-com boom/bust period and therefore, he believes that the stock’s downside potential is limited towards the lower end of the historical range that he established.
Cramer said, “Based on these past declines, an expected price decline this time around is somewhere between -60% and -70%. I'm inclined to think there is more cash floating around going into this coming recession, and there are a lot of retirees who would probably be willing to come in and buy JPM stock because they know the name well, and JPM is perceived as relatively safe. So, I wouldn't count on JPM stock falling into the deeper end of that range, and I would consider buying after a -60% drawdown, rather than aiming for a deeper decline (at least initially).” With that in mind, he concluded, “JPM's price peaked at about $172.96 this cycle. If it sold off -60% from there, that would produce a buy price of $69.18 per share, and that's when I'll be a buyer.” All in all, Cramer wrote, “Currently, that would be a buy price of $69.18, which is about -35% lower than where the stock trades today.”
Overall, the vast majority of credible authors and analysts that the Nobias algorithm tracks take the bullish side of the argument when it comes to JPM shares. 91% of recent articles written about the stock by credible authors (only those with 4 and 5-star Nobias ratings) have expressed a “Bullish” bias. Right now, the average price target being applied to JPM shares by the credible Wall Street analysts that our algorithm tracks (once again, only those with 4 and 5-star Nobias ratings) is $140.88. JPM closed the trading day on Friday at $112.95. Therefore, relative to this average price target, JPM shares present upside potential of approximately 24.7%.
Disclosure: Nicholas Ward has no JPM position. Nicholas Ward wrote this article for Nobias at their request with a view of giving investors a balanced perspective based on the writings of Nobias highly rated analysts and bloggers. Nobias has no business relationship with any company whose stock is mentioned in this article and does not have a position in this stock.
Additional disclosure: All content is published and provided as an information source for investors capable of making their own investment decisions. None of the information offered should be construed to be advice or a recommendation that any particular security, portfolio of securities, transaction, or investment strategy is suitable for any specific person. The information offered is impersonal and not tailored to the investment needs of any specific person.
Disclaimer: The Nobias star rating is based on past performance results and is not an indicator of future results. These past performance returns do not represent returns that any investor actually earned. Assumptions made include the ability to purchase the stocks recommended by the author under liquid markets where the transaction would be at the market price for the day. In reality, loss in liquidity may have a material impact on the returns that actually may have been earned. Further, returns are calculated without any including transaction costs, management fees, performance fees or expenses, or reinvestment of dividends and other income. This information is provided for illustrative purposes only.
PEP with Nobias Technology: Case Study on Pepsi
J.P. Morgan (JPM) reported its second quarter earnings on Thursday, July 14th, missing Wall Street consensus estimates on both the top and bottom lines. The company posted revenues of $30.7 billion, which were $1.12 billion lower than consensus. JPM’s GAAP earnings-per-share totaled $2.76, which was $0.13/share below Wall Street’s average target.
The second quarter earnings season is just getting underway and with the June CPI data in hand, many investors are anxious to see what sort of impact the highest inflation that we’ve witnessed in 40 years will have on the fundamental results of stocks.
PepsiCo (PEP) reported earnings this week and shortly after the company’s results were made public, Nobias 5-star rated author, AJ Fabino, published an interview with Navellier & Associates founder and Chief Investment Officer Louis Navellier, which touched upon the current macro environment, and PEP’s results specifically, as a potential bellwether for the market as we forge further into the Q2 earnings season.
Aftering being asked, “How Do You Feel About Defensive [stocks] Coming Forward After Pepsi’s Report?” Navellier responded: “Clearly, the consumer is still spending. They want their chips and soft drinks. Pepsi’s international products are selling better than domestic products. It’s a good sign, we keep hearing that we’re in a recession — but, we keep creating jobs; we’re not in an earnings recession, earnings are still growing. Given that, year-over-year comparisons are becoming more difficult. So, Pepsi raising guidance today helped the entire market.”

PEP Jul 2022
Eric Schoeder, a Nobias 4-star rated author, published a report at Food Business News, which broke down the company’s results in great detail. Schoeder began his piece stating, “A pre-tax impairment charge related to the war in Ukraine dragged down second-quarter earnings at PepsiCo, Inc. but didn’t dampen the spirits of company executives who said business momentum continues.”
With regard to management’s upbeat tone, Schoeder quoted Ramon Laguarta, Pepsi’s chairman and chief executive officer, who highlighted the company’s growth during the recent earnings call. Laguarta said, “Our results are indicative of our highly dedicated employees, the strength and resilience of our categories, agile supply chain and go-to-market systems and strong marketplace execution. Our performance also gives us confidence that our investments to become an even Faster, even Stronger, and even Better organization by winning with pep+ are working. Given our year-to-date performance, we now expect our full-year organic revenue to increase 10% (previously 8%) and we continue to expect core constant currency earnings per share to increase 8%.”
On the top-line, PEP beat Wall Street’s expectations. During the quarter, Schoeder said that Pepsi’s net revenues “increased to $20.23 billion from $19.22 billion.” Wall Street analysts were expecting to see $19.51 billion, so PEP’s $20.23 mark not only represented 5.3% year-over-year growth, but also a $720 million beat.
With regard to PEP’s bottom-line, Schoeder wrote, “Net income in the second quarter ended June 11 totaled $1.43 billion, equal to $1.03 per share on the common stock, down 39% from $2.36 billion, or $1.70 per share, in the same period a year ago. The most recent quarter included a $1.4 billion pre-tax impairment charge related to the Russia-Ukraine conflict as well as a $13 million gain from the sale of the Tropicana, Naked and other select juice brands to PAI Partners.”
Schoeder broke down the food & beverage giant’s operational segment results, stating, “Operating profit at Frito-Lay North America (FLNA) totaled $1.45 billion, up 4.8% from $1.38 billion in the second quarter of fiscal 2021. Net revenue in the unit also increased, climbing nearly 14% to $5.18 billion from $4.55 billion.” He continued, noting, “Within the Quaker Foods North America (QFNA) unit operating income was $135 million, up 5.5% from $128 million in the same period a year ago. Net revenue was $675 million, up 17% from $575 million.”
Then, Schoeder said, “Operating profit in the PepsiCo Beverages North America (PBNA) unit totaled $651 million, down 20% from $809 million in the same period a year ago. Net revenue totaled $6.12 billion, down from $6.16 billion.”
Petar Mirkovic, a Nobias 4-star rated author, recently published an article at Seeking Alpha which also highlighted the strength of PEP’s recent quarter. He stated, “In the almost ever-increasingly difficult stock market situation we find ourselves in today, as market liquidity is being sucked out by high-interest rates, 40-year high record inflation numbers, and ongoing geopolitical crises caused by the Ukraine conflict, there are only a few companies that seem truly resilient to the ongoing crisis, and leading the way is none other than PepsiCo itself.”
Mirkovic continued, “The food and snack giant has solidified its position as a rock-solid inflation hedge and a top-class defensive stock in the eyes of many as it once again comes out swinging for its second quarter results showcasing its immense moat and pricing power that allowed it to push nearly all of the negative impacts down to the end customer.”
Mirkovic highlighted the top and bottom-line results, then stated, “More importantly, the company has shown strong resilience to the ongoing macroeconomic situation and once more solidified its position as an inflation hedge and a top-class defensive stock.” He went on to say, “A key metric in the staples space, organic sales have risen 13% in the quarter as well.”
Mirkovic clarified the importance of this data, stating, “An interesting way to look at the data is that "organic revenues" growth was set at 13%, while "organic volume" grew by only 1% this quarter, effectively meaning that demand stayed the same on aggregate, while prices were raised by roughly 12%. By itself, this can be viewed as a testament to the pricing power that PepsiCo commands.”
Mirkovic pointed out that PepsiCo’s ability to increase prices (via strong pricing power) shows the strength of its brands and the company’s ability to produce strong cash flows, even during volatile environments. He touched upon the ongoing issues that the company faces, especially in Europe, where circumstances outside of management’s control (the loss of sales in the Ukrainian and Russian markets due to the war) resulted in lower than expected volumes. But, Mirkovic said that this issue doesn’t point towards a global trend for Pepsi. He wrote, “Developing and emerging markets, on the other hand, remained resilient and managed to deliver double-digit organic revenue growth in the quarter.”
Regarding pricing power, Mirkovic concluded, “At the end of the day, the macroeconomic situation as bad as it is still hasn't gotten to a point at which it would chip away at the demand for PepsiCo's food and beverage family of products. Management felt that and was comfortable raising prices and pushing all the negative effects toward the end customer, which at least as far as the data tells us, has largely stayed loyal to the brands.”
Because of pricing power and the relatively strong cash flows that it allows PepsiCo to generate, Mirkovic noted that PEP has been able to be very generous to its shareholders with shareholder returns. He celebrated the company’s dividend, stating, “One of the strongest arguments for the food and beverage giant is its attractive dividend or more precisely, its commendable dividend growth story. PepsiCo is a company that has been successful in raising its dividend each year for the past 50 years, ultimately earning it the title of a "Dividend King" this year. This is an achievement so rare that only 31 companies held the status as of last year.”
In his conclusion, Mirkovic put a spotlight on the high quality metrics that PEP offers investors, writing, “As a result, PepsiCo was successful in solidifying its position as a great inflation hedge and a top-class defensive stock, which no doubt helped the company outperform the market for the first time in years, with the maker of Lays, Pepsi, and Mountain Dew generating a market alpha of 18.43% year-to-date and a 23.02% one-year alpha. In fact, with almost the entire rest of the market selling at significant discounts even as compared to pre-pandemic prices, the valuation situation has arguably gotten even more complicated.”However, after generating such strong alpha, Mirkovic could not offer a “Buy” rating on shares, due to relative valuation concerns.
Nicholas Ward is a Senior Investment Analyst at Wide Moat Research. He has spent the last 8 years writing about the stock market at various publications, including Seeking Alpha, The Street, Forbes Real Estate Investor, Sure Dividend, The Dividend Kings, iREIT, Safe High Yield, and The Intelligent Dividend Investor.
After its strong year-to-date performance, PEP shares trade with a 26.3x blended price-to-earnings ratio. This multiple is above the stock’s historical 5, 10, and 20-year price-to-earnings rate averages of 24.8x, 22.1x, and 21.1x, respectively.
With this outsized premium in mind, Mirkovic finished off his report stating, “With fully recognizing PepsiCo as a brilliant business that we would love to own, we simply cannot escape the conclusion that the current market premium assigned to the company is significantly limiting its prospect of being a great investment opportunity.”
Looking at the overall data collected by the Nobias algorithm when looking at the bullish/bearish bias expressed by the credible authors and Wall Street analysts that we track, we see an aggregate opinion that is somewhat in-line with Mirkovic’s. 90% of recent articles written by credible analysts focused on PEP shares have highlighted the company’s strong quality and expressed a “Bullish” bias.
However, when looking at the average price target currently being attached to the stock by the community of Wall Street analysts that Nobias tracks, we see limited upside potential from here. PEP currently trades for $170.98/share. Right now, the average price target that credible analysts have for PEP is $188.00. This implies upside potential of approximately 10% and results in a “neutral” overall sentiment from the credible analyst community.
Disclosure: Nicholas Ward is long PEP. Nicholas Ward wrote this article for Nobias at their request with a view of giving investors a balanced perspective based on the writings of Nobias highly rated analysts and bloggers. Nobias has no business relationship with any company whose stock is mentioned in this article and does not have a position in this stock.
Additional disclosure: All content is published and provided as an information source for investors capable of making their own investment decisions. None of the information offered should be construed to be advice or a recommendation that any particular security, portfolio of securities, transaction, or investment strategy is suitable for any specific person. The information offered is impersonal and not tailored to the investment needs of any specific person.
Disclaimer: The Nobias star rating is based on past performance results and is not an indicator of future results. These past performance returns do not represent returns that any investor actually earned. Assumptions made include the ability to purchase the stocks recommended by the author under liquid markets where the transaction would be at the market price for the day. In reality, loss in liquidity may have a material impact on the returns that actually may have been earned. Further, returns are calculated without any including transaction costs, management fees, performance fees or expenses, or reinvestment of dividends and other income. This information is provided for illustrative purposes only.
TWTR with Nobias Technology: Case Study on Twitter
On Friday news broke that Elon Musk was abandoning his plans to acquire Twitter. These headlines occurred after the stock market closed on Friday, yet during the after-market trading session, shares of Twitter (TWTR) fell by nearly 5% and shares of Tesla (TSLA) rose by nearly 2.5%.
Nobias has covered the Musk/Twitter saga with several articles/updates thus far and therefore, we wanted to see what credible authors have had to say about Musk’s new plans over the weekend. Furthermore, we wanted to take a look at the sentiment being expressed by credible authors and Wall Street analysts alike, regarding shares of Twitter and Tesla, both of which have been caught up in this M&A whirlwind for months.
On Friday evening, shortly after the Musk/Twitter break-up news broke, Joshua Summers, a Nobias 4-star rated author, published a report at the Latin Post which highlighted the recent happenings. Summers wrote, “Elon Musk terminated his billion-dollar deal with Twitter on Friday, prompting the social media company to threaten the Tesla mogul with legal action.” He continued, “According to DW, Musk terminated his $44 billion bid with Twitter through a letter addressed to the company's board.”
Finally, Summers said, “In the letter, Elon Musk accused Twitter of lying about the number of bots and spam accounts on the social media platform, according to CBS News.” Regarding the alleged bot issue at Twitter, Summers said, “The letter claimed that the advisors of the Tesla mogul analyzed the number of bots on the platform, and they found a number "wildly higher than 5%". Twitter has previously claimed that fewer than 5% of its users are spam or fake accounts.”

TWTR Jul 2022
Also, Summer noted, “Musk's buyout also claimed that Twitter failed to provide Musk with the materials he asked for, including the company's methodology for calculating its user numbers and backup materials detailing its financial valuation.”
Looking at the situation from Twitter’s standpoint, Summers said, “Twitter will resort to legal actions if Musk does not push through with his deal with the social media company.” He highlighted a Tweet that went out from Twitter Chairman, Brett Taylor, who said, “The Twitter Board is committed to closing the transaction on the price and terms agreed upon with Mr. Musk and plans to pursue legal action to enforce the merger agreement. We are confident we will prevail in the Delaware Court of Chancery.” According to Summers, “Musk will have to pay a $1 billion termination fee if the deal falls out.”
Kari Paul, a Nobias 4-star rated author touched upon this exit fee in an article published on Saturday, July 9th, saying, “Musk may also face a fine of $1bn to walk away, a penalty he is seeking to evade by accusing Twitter of a “breach of multiple provisions” of the agreement, according to a letter filed with the Securities and Exchange Commission announcing the dissolution of the offer.”
Paul quoted Anat Beck, a professor and business law expert at Case Western Reserve University, who said, “What Musk and his team are doing is trying to come up with an excuse so that he doesn’t have to pay the penalty fees to walk away.”
Paul noted, “In addition to the fine for the failed deal, Musk could face serious consequences from the SEC for his antics, which have had major impacts on the several public companies he manages as well as Twitter itself.”
Paul continued, “Fines against Musk, who with a $224bn net worth is now the richest man in the world, have had negligible impacts, said Beck, but the executive could face further action from the SEC – including being removed as CEO from one or more of the companies he helms.”
Furthermore, Paul wrote, “Musk’s waffling on the Twitter decision has led many to call for legislation that prevents such market chaos in the future, or enforcement from bodies outside the SEC. Meanwhile, Musk and Twitter could be battling in court for some time, and Musk will face additional class action lawsuits, Beck said.”
With that in mind, it appears that this issue is likely to be an overhang for Musk, Twitter, and the companies that Musk manages, for quite some time.
And yet, according to Liana Baker, a Nobias 5-star rated author, who recently published a piece at Bloomberg highlighting Elon Musk’s recent Twitter drama, it doesn’t appear as if Musks twitter issue is going to hurt his relationship with bankers and/or the potential of other large-scale M&A from occurring in the near-term.
Baker’s piece highlighted the fact that many bankers (via named and unnamed sources) would be happy to continue to work with much, even though, as the author said, “It isn’t the first time billionaire Tesla Inc. founder Elon Musk burned his investment bankers on deals and it may not be the last.”
She noted, “It was the second time in five years that Musk fielded an ambitious acquisition idea that got Wall Street’s hopes up, only to change his mind. In that 2018 episode, Musk tweeted about taking Tesla private with the claim “funding secured.”’
Paul touched upon this episode in her piece as well, writing, “The market-moving 2018 tweet resulted in a $40m fine from the SEC, as well as an agreement that Musk would step down as chairman of the Tesla board.”
However, as volatile and unpredictable as Musk may be, Baker highlighted the ongoing demand for business relationships with him from members of the financial industry, stating, “One banker said it’s hard to ignore the mercurial Musk, the world’s richest person, even if he shoots from the hip on mega deals. Musk’s personal wealth totals almost $227 billion, according to data compiled by Bloomberg.”
Baker quoted Mark Boidman, head of media and entertainment at Solomon Partners, who touched upon Musk’s alluring nature, saying, “He’s a once in a lifetime client. He’s created some of the most iconic companies, of course everybody wants to be his banker.”
Baker highlighted the size and scale of Musk’s business empire, writing, “Tesla, which has a market value of almost $780 billion, could also pursue transactions, whether it’s M&A or debt financing. Musk’s futuristic brain-computer interface startup Neuralink has also been in fundraising mode and has attracted more money than other companies in the field. Meanwhile, his tunneling startup, Boring Co., was valued at $6 billion in April.”
Looking at the sentiment expressed by credible authors and analysts that Nobias tracks, there is a trend developing with regard to both sides of this dispute (meaning, Twitter and Tesla). The credible authors that we follow (only individuals with 4 and 5-star Nobias ratings) are expressing bearish sentiment for both companies. 75% of recent reports published by credible authors on TWTR and 69% of reports published by credible authors on TSLA have expressed a “Bearish” bias.
Nicholas Ward is a Senior Investment Analyst at Wide Moat Research. He has spent the last 8 years writing about the stock market at various publications, including Seeking Alpha, The Street, Forbes Real Estate Investor, Sure Dividend, The Dividend Kings, iREIT, Safe High Yield, and The Intelligent Dividend Investor.
However, while the author community remains bearish on both stocks, the credible Wall Street analysts that we track appear to be much more bullish. Right now, the average price target being applied to TWTR shares by the credible analysts that Nobias tracks (once again, only those with 4 and 5-star Nobias ratings) is $50.40. The average price target that credible analysts are currently applying to TSLA is $937.50.
Today, TWTR shares trade for $36.81 (however, it’s important to note that they fell by 4.94% in the after-hours trading period of Friday and therefore, could end up trading for much lower than their closing price on Friday once markets open up next week). Therefore, the average analyst price target for TWTR implies upside potential of approximately 36.9%. TSLA shares closed the trading session on Friday at $752.29. Therefore, the average analyst price target for TSLA implies upside potential of approximately 24.6%.
While several bearish articles were posted on Twitter over the weekend by credible authors, Nobias has not seen any credible analyst update their price target for TWTR over the weekend. We expect to see that occur next week and the Musk/Twitter news could certainly have a notable impact on the consensus price target. But, for the time being, credible individuals on Wall Street remain bullish on both TWTR and TSLA.
Disclosure: Disclosure: Nicholas Ward has no position in either TWTR or TSLA. Nicholas Ward wrote this article for Nobias at their request with a view of giving investors a balanced perspective based on the writings of Nobias highly rated analysts and bloggers. Nobias has no business relationship with any company whose stock is mentioned in this article and does not have a position in this stock.
Additional disclosure: All content is published and provided as an information source for investors capable of making their own investment decisions. None of the information offered should be construed to be advice or a recommendation that any particular security, portfolio of securities, transaction, or investment strategy is suitable for any specific person. The information offered is impersonal and not tailored to the investment needs of any specific person.
Disclaimer: The Nobias star rating is based on past performance results and is not an indicator of future results. These past performance returns do not represent returns that any investor actually earned. Assumptions made include the ability to purchase the stocks recommended by the author under liquid markets where the transaction would be at the market price for the day. In reality, loss in liquidity may have a material impact on the returns that actually may have been earned. Further, returns are calculated without any including transaction costs, management fees, performance fees or expenses, or reinvestment of dividends and other income. This information is provided for illustrative purposes only.
NOC with Nobias Technology: Case Study on Northrop Grumman
Throughout 2022, defense contractors have been one of the few rays of sunshine for investors in the stock market. For months, positive sentiment has surrounded the defense stocks with talk of the U.S. and its NATO allies increasing the size of their defense budgets to combat the Russian threat. Many of the large U.S. defense players have posted strong positive total returns on a year-to-date basis, overcoming the inflationary headwinds, in large part, due to bullish momentum created by the war in Ukraine. However, in recent days, that tide has turned a bit, with large cap defense stocks posting negative returns over the last month.
Throughout 2022, defense contractors have been one of the few rays of sunshine for investors in the stock market. For months, positive sentiment has surrounded the defense stocks with talk of the U.S. and its NATO allies increasing the size of their defense budgets to combat the Russian threat. Many of the large U.S. defense players have posted strong positive total returns on a year-to-date basis, overcoming the inflationary headwinds, in large part, due to bullish momentum created by the war in Ukraine. However, in recent days, that tide has turned a bit, with large cap defense stocks posting negative returns over the last month.
During the last 30 days, shares of Lockheed Martin (LMT) are down 3.90%, shares of General Dynamics (GD) are down 5.28%, shares of Raytheon Technologies (RTX) are down 2.88%, shares of L3Harris Technologies (LHX) are down 1.23%, and shares of Northrop Grumman (NOC) are up 0.85%. Now, all of these results are still relatively higher than the -7.43% returns that the S&P 500 index has posted during the last month. Furthermore, on a year-to-date basis, each of these stocks has also posted total returns that represent relative outperformance when compared to the S&P 500.
LMT’s year-to-date gains are 20.19%, GD’s year-to-date gains are 5.83%, RTX’s year-to-date gains are 7.99%, LHX’s year-to-date gains are 13.25%, and NOC’s year-to-gate gains are 24.99%. For comparison’s sake, the S&P 500 is down 19.84% on a year-to-date basis. But, even with all of this bullishness in mind, earlier this week we saw a day where most of these names were down in the 4-6% range, with little to no significant news coming out of Ukraine. Since then, there has been a slight rebound, but that near-term weakness posed the question, are these outperformers starting to show cracks in their armor? And, with that in mind, we wanted to take a look at reports published by credible authors and analysts which have focused on Northrop Grumman (the best year-to-date performer of this space) to see whether or not this is a company that investors should still have on their watch lists.

NOC Jul 2022
After NOC’s most recent earnings report (which was posted in late April), Sejuti Banerjea, a Nobias 4-star rated author, covered the company’s operational results in an article published at zacks.com. Banerjea wrote, “Northrop Grumman’s March quarter was a bit of a mixed bag. While revenue missed estimates by less than a percent and grew from the year-ago quarter by a mere 3.6%, its earnings were a bit more encouraging, growing 8.6% to beat the Zacks Consensus Estimate by 2.5%.”
Looking at operating segment data, Banerjea said, “Aeronautics Systems revenue of $2.703 billion beat estimates by 1.3%; Defense Systems revenue of $1.283 billion missed by 10.9%; Mission Systems revenue of $2.497 billion missed by 3.7% and Space Systems revenue of $2.855 billion beat by 4.9%. Net intersegment eliminations of -$541 million missed by 5%.”
In conclusion, Banerjea wrote, “Northrop Grumman’s overall performance was more or less in line with what analysts expected with the aeronautics segment being the main outperformer, both in terms of revenue and profitability.”
Dhierin Bechai, a Nobias 4-star rated author, more recently touched upon NOC’s first quarter results in an article at Seeking Alpha titled, “Northrop Grumman: A Defense Winner With Growth And A Dividend”. In that piece, Bechai provided relatively bearish commentary on the Q1 results, touching upon the poor revenue growth as well as issues with margins (overall), stating, “While Aeronautics and Defense Systems revenues dropped, their margins improved, which led to stable operating income for Aeronautics Systems while the profit for Defense Systems declined by 12% on a 18% reduction in revenues. Mission systems margins remained more or less stable producing a 3% decline in profits. The strong surge in Space Systems revenues did not translate into higher profits as a 180 points reduction in margin more than offset the topline performance. Overall, income was 5% lower on 4% lower revenues.”
He continued, “As an investor, you would like to see top- and bottom-line growth but Northrop Grumman did not produce a year-over-year growth on either metric and when listening to the call and going through the call I found that the company provided extremely little color to what caused the declines.”
Ultimately, Bechai said that on page 75 of its recent 10-Q, NOC noted that “COVID-19, employee leave and supply chain challenges” were the primary contributors to the margin issues. But, as concerning as the Q1 report was, Bechai maintained a bullish stance on the company moving forward, writing, “While I would like to have seen Northrop Grumman provide more color on the margin and revenue pressures, I was pleased with the detail the Defense company provided for 2022 and the upcoming years.”
Looking at full-year 2022 guidance, Bechai wrote, “For 2022, Northrop Grumman maintained its guidance with $36.2 billion to $36.6 billion in sales and 11.7%-11.9% operating margin resulting in a $24.50-$25.10 adjusted earnings per share.”
Bechai said, “Overall, Northrop Grumman is guiding for 1.4% to 2.5% increase in revenues and $4.2 billion to $4.36 billion in profits. That provides a 3% uptick in profits unadjusted for inflation.” He continued, “I would say that the outlook for 2022 is not spectacular and neither is the 24% to 25% of full-year revenues that's expected in the second quarter. More useful is the color provided beyond 2022.”
Regarding longer-term growth prospects, he stated, “the company expects acceleration of revenue growth in the second half of the year as reflected in the guidance and that momentum to carry into 2023. In 2023, the aeronautics revenues will be more or less flat with growth returning in 2024 supported by the B-21 strategic bomber. In 2023-2024, Northrop Grumman sees the earliest opportunities for meaningful impact on contracts awards as international customers increase defense budgets while margins will tick up to 12%.”
Concluding his piece, Bechai said, “Northrop Grumman increased its dividend by 10% earlier this year and I believe that while its yields is not the most attractive, the combination of revenue growth, share repurchases and dividend hikes provide a solid investment opportunity in a market that is currently plagued by inflation but has seen demand for defense equipment rising.”
Jed Graham, a Nobias 4-star rated author, also recently highlighted his bullish outlook on NOC in an article published at investors.com. Graham highlighted a new $800 million round of military aid that the U.S. is providing Ukraine as a bullish catalyst for the stock. He continued, stating, “A potentially bigger deal for Northrop was the June 24 news it reached the next stage of the competition for a multibillion-dollar contract for missiles to intercept hypersonic weapons. That puts it head-to-head against Raytheon Technologies, while Lockheed Martin was eliminated.”
Graham also noted, “Northrop has been one of the big winners as the strategic implications of Russia's invasion boosts defense budgets, with Biden requesting $773 billion for fiscal 2023. That includes funds for initial production of Northrop's B-21 Raider stealth bomber and an increase in funds for developing an intercontinental ballistic missile known as the Ground Based Strategic Deterrent.”
Nicholas Ward is a Senior Investment Analyst at Wide Moat Research. He has spent the last 8 years writing about the stock market at various publications, including Seeking Alpha, The Street, Forbes Real Estate Investor, Sure Dividend, The Dividend Kings, iREIT, Safe High Yield, and The Intelligent Dividend Investor.
Regarding the large contracts the NOC has garnered in recent years, Graham stated, “The Air Force plans to spend $20 billion for B-21 production over five years. In 2020, Northrop received a $13.3-billion contract to develop the new ICBM.”
Like Bechai, Graham acknowledged poor fundamental growth in recent quarters from NOC; however, he said that several major projects underway have the potential “to fuel growth in 2023 and beyond.”
Overall, the vast majority of credible authors (those that have earned 4 and 5-star ratings by the Nobias algorithm) share this bullish sentiment. 90% of recent articles published on NOC by credible authors have expressed a “Bullish” sentiment.
However, the credible Wall Street analysts that the Nobias algorithm tracks are less bullish. Right now, the average price target being applied to NOC shares by credible analysts is $477.33. Right now, NOC trades for $481.87. Therefore, the average price target supplied by credible analysts implies downside of approximately 0.94%. With that in mind, it appears that NOC shares are hovering right around fair value at the moment and bullish investors are going to have to look out further into the future to find the catalysts that could push Northrop Grumman to new highs.
Disclosure: Of the stocks discussed in this article, Nicholas Ward is long NOC, LMT, RTX, and LHX. Nicholas Ward wrote this article for Nobias at their request with a view of giving investors a balanced perspective based on the writings of Nobias highly rated analysts and bloggers. Nobias has no business relationship with any company whose stock is mentioned in this article and does not have a position in this stock.
Additional disclosure: All content is published and provided as an information source for investors capable of making their own investment decisions. None of the information offered should be construed to be advice or a recommendation that any particular security, portfolio of securities, transaction, or investment strategy is suitable for any specific person. The information offered is impersonal and not tailored to the investment needs of any specific person.
Disclaimer: The Nobias star rating is based on past performance results and is not an indicator of future results. These past performance returns do not represent returns that any investor actually earned. Assumptions made include the ability to purchase the stocks recommended by the author under liquid markets where the transaction would be at the market price for the day. In reality, loss in liquidity may have a material impact on the returns that actually may have been earned. Further, returns are calculated without any including transaction costs, management fees, performance fees or expenses, or reinvestment of dividends and other income. This information is provided for illustrative purposes only.
COIN with Nobias Technology: Case Study on Coinbase
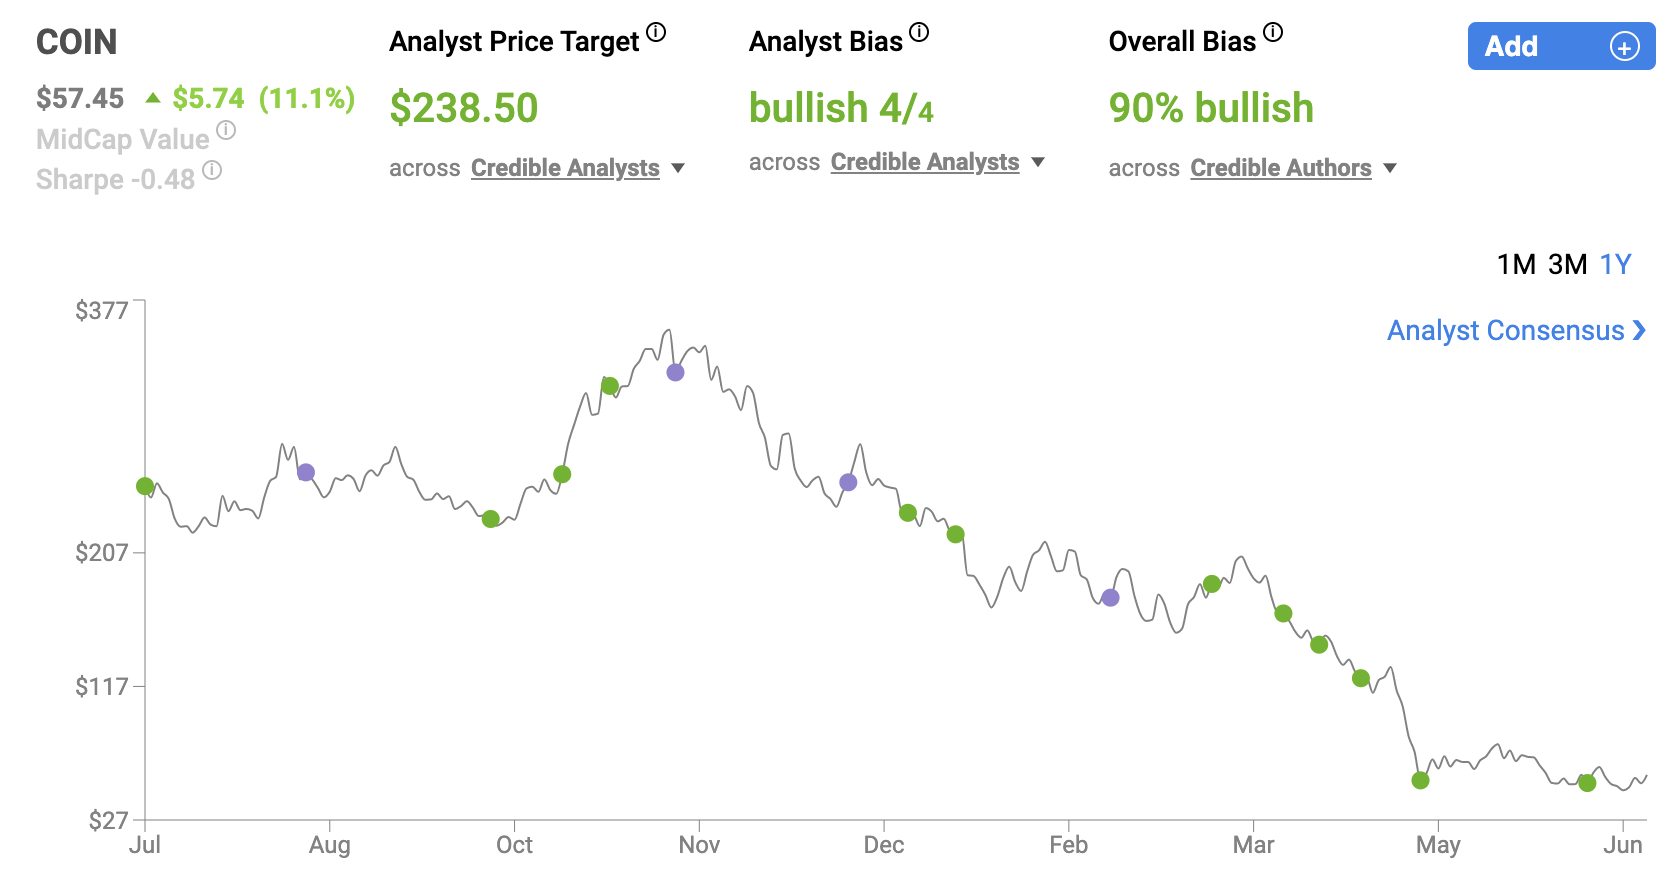
Coinbase (COIN) was one of the hottest new stocks to begin public trading in 2021. The stock came public via a direct listing in April of 2021. At the time, market markers expected the stock to open trading in the $250 range; however, COIN shares opened trading in the $381 area. They quickly rose to $429.54 before trading down to $328.28, where they closed after their first day trading on the Nasdaq.
Coinbase (COIN) was one of the hottest new stocks to begin public trading in 2021. The stock came public via a direct listing in April of 2021. At the time, market markers expected the stock to open trading in the $250 range; however, COIN shares opened trading in the $381 area. They quickly rose to $429.54 before trading down to $328.28, where they closed after their first day trading on the Nasdaq.
This move equated to an $85.8 billion market cap on a fully diluted basis. With the benefit of hindsight, the violent trading that COIN shares experienced on their first day of trading was a precursor of things to come. Since April of 2021, COIN shares have sold off down to the $220 area, risen back up to the $368 range, and then most recently plunged down to all-time lows of $40.88.
Today, Coinbase shares trade for $49.04, down roughly 86.7% from their 52-week highs. And, while there is no sign that volatility is about to abandon these shares, the credible authors and analysts that we track with the Nobias algorithm remain overwhelmingly bullish on COIN shares.
COIN Jun 2022
Coinbase posted first quarter earnings on May 10th, missing Wall Street consensus estimates on both the top and bottom lines. Since then, COIN shares have fallen by approximately 32.8%. Nobias 4-star rated author, David Trainer, covered Coinbase’s Q1 report in a recent article published at Seeking Alpha titled, “Q1 2022 Earnings Shows Coinbase's Struggles”.
Trainer said, “Coinbase's 1Q22 results and guidance do not bode well for the future, and we think shares are worth as little as $17/share even with optimistic assumptions for long-term margins and revenue growth.”
Regarding the company’s fundamentals, Trainer wrote: “As noted in our prior update in March 2022, the growth and profitability achieved by Coinbase in 2021 was unsustainable - 1Q22 proved as much. In the quarter Coinbase's:
net operating profit after-tax (NOPAT) margin fell to -19%, down from 43% in 1Q21
invested capital turns fell from to 0.4, down from 1.4 in 1Q21
return on invested capital (ROIC) fell to -7%, down from 58% in 1Q21
free cash flow (FCF) was -$1.4 billion, compared to $969 million in FCF in 2021.”
Looking at the guidance that COIN management provided, Trainer stated, “Going forward, we expect Coinbase's margins and revenue growth rates to decline as competition increasingly eats into its business. Increased volatility, or further downward movement, in the crypto market could also spook retail investors after big losses so far this year.”
Regarding that guidance, he noted: “Guidance shows:
MTUs [monthly transacting users] is expected to be lower in 2Q22 than 1Q22
total trading volume expected to be lower in 2Q22 than 1Q22
expected range for MTUs in 2022 anywhere from 5 to 15 million, not exactly a precise estimate
ATRPU in 2022 is expected to return to "pre-2021" levels, which certainly implies a decline”
Trainer also noted a quote that appeared in the 10Q that Coinbase filed with the SEC and the potential for it to further damage investor sentiment.
COIN stated, "in the event of a bankruptcy, the crypto assets we hold in custody on behalf of our customers could be subject to bankruptcy proceedings and such customers could be treated as our general unsecured creditors." Trainer continued, “This public acknowledgement could spark fear in the company's clients. The fear of bankruptcy proceedings could drive clients to cash out their investments as quickly as possible, further weakening Coinbase's business, and bringing the company even closer to bankruptcy.”
Trainer concluded, “Looking forward, we expect the company's profitability to diminish as expenses rise and growth slows with crypto adoption losing momentum and regulations rising.”
However, shortly after COIN’s earnings, Nobias 4-star rated author, Investor Trip, posted a bullish piece on COIN, titled, “Coinbase: Be Greedy During The Crypto Market Crash”. Investor Trip acknowledged COIN’s recent poor performance, stating, “The company posted an awful Q1 2022 due to the crypto bear market and investors started fleeing for the exits. COIN stock is down 78% YTD due to the current crypto bear market.”
Yet, they continued, “However, I've been a passionate user of Coinbase since 2018 and won't sell a single share during this current market crash.” Regarding the Q1 miss, Investor Trip said, “Coinbase suffered a big dip in monthly transacting users, trading value, and assets on the platform in comparison to Q4 2021, triggering a massive 25% selloff after Q1 2022 earnings release.”
The author suggested that the numbers weren’t as bad as they appeared, though, writing, “Lower crypto prices caused a $258 million impairment charge because the SEC requires all companies holding crypto assets to include any losses when they fall below their cost basis. Removing impairment charges, Coinbase lost around $172 million per quarter.”
Furthermore, Investor Trip seems to suggest that COIN’s near-term future may not be as bright as their bullish title suggests, saying, “Bitcoin prices have fallen substantially since the beginning of 2021, which has caused COIN shares to fall. This is completely normal as Bitcoin enters the 2nd half of its current halving cycle. In fact, Bitcoin has historically fallen as much as 80% during the bottom of its bearish cycle. That means COIN stock could trade much lower as we head towards the 2nd half of 2022.”
Long-term, the author believes that COIN’s steps with regard to revenue stream diversification are what sets the stock up to outperform. Investor Trip said, “Coinbase turned 10 years old this year and is no longer just a cryptocurrency broker and exchange.” They continued, “In April, Coinbase launched its NFT marketplace to compete with Opensea and generate revenue from the growing NFT industry but initial activity has been slow.”
“Secondly,” they wrote, “5.8 million Coinbase users staked their crypto on Coinbase to generate yield with their assets in Q1 2022.” “Thirdly,” Investor Trip said, “Coinbase plans to launch crypto derivatives products similar to options trading that allow users to profit from short and long-term crypto price movements. In February, Coinbase acquired FairX to help ease its transition into derivatives.”
Finally, Investor Trip concluded that COIN is “all about user growth” stating, “Coinbase user growth grew at a 75% CAGR over the last year as the company continues to rack up more user growth despite falling crypto prices.” Therefore, Investor Trip wrote, “Long-term investors have a wonderful opportunity to acquire an industry-leading company with a growing user base at rock bottom prices.”
Regarding the fearful statement that COIN made about the potential of bankruptcy, Investor Trip said, “Also, Coinbase filed a shelf registration with the SEC and may need to sell stock in order to stay afloat. Coinbase CEO Brian Armstrong denied that the company is at risk of bankruptcy on Twitter so hopefully the company has plenty of cash to make it through the crypto bear market.”
In a recent series of tweets, Armstrong said, “Your funds are safe at Coinbase, just as they’ve always been.” Investor Trip also noted, “Many investors have expressed concerns about Coinbase filing for bankruptcy due to running out of cash. The company held $6.1 billion in cash on its balance sheet at the end of Q1 (including $180 million in USC and $1 billion in various crypto assets).”
Ultimately, the author concluded, “Cryptocurrency is the future of finance and isn't going anywhere. I expect Coinbase to remain a leader in the industry for years to come.” While COIN shares have continued to trend lower post-earnings, Shrey Dua, a Nobias 4-star rated author, noted that famed growth investor, Cathie Wood of ARK Investments, continues to buy COIN shares.
On June 3rd, Dua wrote, “It seems crypto exchange Coinbase is Cathie Wood’s latest obsession. Wood has continued to buy COIN stock despite its recent tumble. Indeed, Wood, known for her high-growth strategy, has apparently pegged Coinbase as the latest undervalued disruptor.”
Nicholas Ward is a Senior Investment Analyst at Wide Moat Research. He has spent the last 8 years writing about the stock market at various publications, including Seeking Alpha, The Street, Forbes Real Estate Investor, Sure Dividend, The Dividend Kings, iREIT, Safe High Yield, and The Intelligent Dividend Investor.
Dua continued, “Wood has made 20 purchases of COIN since March 25, buying between 3,900 and 187,000 shares with each investment. In fact, in the past week alone, Wood has purchased COIN on three separate occasions across her various funds.”
It’s important to note that Wood’s funds have experienced a lot of negative volatility during 2o22, which has caused certain investors to question her acumen (ARK’s leading fund, the ARK Innovation ETF (ARKK) is down 57.50% on a year-to-date basis. However, many growth stock effecianados still look to Wood for inspiration so her bullish outlook on COIN shares is certainly an anchor for bullish investors to hold on to during the stock’s recent volatility.
With such strong opinions, on either side of the bull/bear argument, to be found related to COIN, it’s important to look at the consensus of the communities of credible authors and analysts that the Nobias algorithm tracks.
Regarding credible authors (only those with Nobias 4 and 5-star ratings), 90% of recent reports focused on Coinbase have included a “Bullish” bias. And, the average price target currently being applied to COIN shares by the credible Wall Street analysts that we track (once again, only those with 4 and 5-star Nobias ratings) is $238.50. Relative to COIN’s current share price of $49.04, this consensus price target represents upside potential of approximately 386%.
Disclosure: Nicholas Ward has no COIN position. Nicholas Ward wrote this article for Nobias at their request with a view of giving investors a balanced perspective based on the writings of Nobias highly rated analysts and bloggers. Nobias has no business relationship with any company whose stock is mentioned in this article and does not have a position in this stock.
Additional disclosure: All content is published and provided as an information source for investors capable of making their own investment decisions. None of the information offered should be construed to be advice or a recommendation that any particular security, portfolio of securities, transaction, or investment strategy is suitable for any specific person. The information offered is impersonal and not tailored to the investment needs of any specific person.
Disclaimer: The Nobias star rating is based on past performance results and is not an indicator of future results. These past performance returns do not represent returns that any investor actually earned. Assumptions made include the ability to purchase the stocks recommended by the author under liquid markets where the transaction would be at the market price for the day. In reality, loss in liquidity may have a material impact on the returns that actually may have been earned. Further, returns are calculated without any including transaction costs, management fees, performance fees or expenses, or reinvestment of dividends and other income. This information is provided for illustrative purposes only.
NVDA with Nobias Technology: Case Study on Nvidia Corporation
The last report we published was focused on Micron Technology’s recent earnings report, its updated guidance, and the prevailing bullish sentiment that the Nobias credible authors and analysts had on the company heading into the quarterly release. In that article, we mentioned that even though MU posted a mixed report and provided guidance which showed slowing growth, the stock was only down slightly in the after hours session. It turns out the market’s sentiment surrounding MU soured overnight and Micron ended up trading down nearly 3% during the trading session on Friday. Furthermore, the weak guidance provided by Micron resulted in an industry-wide sell-off in the semiconductor space, causing many of the largest companies to post outsized losses, driving share prices, in several cases, down to new 52-week lows.
The last report we published was focused on Micron Technology’s recent earnings report, its updated guidance, and the prevailing bullish sentiment that the Nobias credible authors and analysts had on the company heading into the quarterly release. In that article, we mentioned that even though MU posted a mixed report and provided guidance which showed slowing growth, the stock was only down slightly in the after hours session. It turns out the market’s sentiment surrounding MU soured overnight and Micron ended up trading down nearly 3% during the trading session on Friday. Furthermore, the weak guidance provided by Micron resulted in an industry-wide sell-off in the semiconductor space, causing many of the largest companies to post outsized losses, driving share prices, in several cases, down to new 52-week lows.
One such company that was caught up in the MU inspired sell-off was Nvidia (NVDA). NVDA and MU aren’t an apples to apples comparison, because while MU produces chips related to memory, NVDA is focused on high-end hardware, largely related to gaming, artificial intelligence, automation, and data center applications. Yet, NVDA was down 4.20% on Friday, regardless.
The stock closed the trading day at $145.23, slightly above its 52-week low of $143.92. NVDA shares are now down 51.78% on a year-to-date basis. They’re now down 58% from their 52-week highs. This share price weakness from NVDA has come as a surprise to many investors due to the fact that in recent years, NVDA has been one of the very best performing stocks in the entire stock market.

NVDA Jun 2022
On 12/31/2018, Nvidia shares were trading for $34.05. They rose by roughly 73% in 2019, closing the year at $59.02. Then, the shares grew by another 121% in 2020, closing that year at $130.55. In 2021, that positive momentum continued, with NVDA posting triple digit growth again, rising by 125% to $294.11. Yet, all of this has changed in 2022.
Some of the negative sentiment surrounding NVDA is related to the risk-off investing environment that we’re living through right now with interest rates on the rise which has damaged demand for long duration risk assets.
Nobias 4-star rated author, Sirisha Bhorgaraju, highlighted this in a recent article that she published on NVDA. Bhorgaraju wrote, “Investors are looking for safer bets and have dumped several tech names over demand concerns amid the ongoing macro uncertainty and high inflation.”
When NVDA posted its Q1 earnings in late May, the company beat Wall Street consensus estimates on both the top and bottom-lines. NVDA’s growth rate remained very strong, with revenues increasing by 46.3% on a year-over-year basis during Q1. Bhorgaraju noted that NVDA’s first quarter results were “better-than-anticipated”; however, she said that “Nvidia failed to impress investors due to its weak second-quarter guidance” and with Micron’s forward growth expectating falling lower than expectations as well (due to macro pressures) investors are fearing growth headwinds playing out here with NVDA as well. In her article, Bhorgaraju said, “Investors are also concerned about the extent to which the crash in cryptocurrency will impact the crypto-mining driven demand for Nvidia’s GPUs.”
Bitcoin continues to struggle, trading below the $20,000 threshold, currently down 59.42% on a year-to-date basis. Other digital currencies are performing much worse on a year-to-date basis. Ethereum, for instance, is down by approximately 72% on a year-to-date basis. And, NFTs (non-fungible tokens) are faring even worse.
The Guardian published an article titled, “NFT sales hit 12-month low after cryptocurrency crash” on Saturday, July 2, 2022, which stated: “Sales of NFTs totalled just over $1bn (£830m) in June, according to the crypto research firm Chainalysis, their worst performance since the same month last year when sales were $648m. Sales reached a peak of $12.6bn in January.”
Nathan Reiff, a Nobias 4-star rated author, also recently published an article which put a spotlight on the poor performance of crypto assets and the negative spill-over effect that this is having on semiconductor stocks like Nvidia.
Reiff wrote, “Cryptocurrencies have shed about two-thirds of their total market capitalization since reaching a high in November 2021, and even dominant virtual currencies like Bitcoin have seen prices plunge. The crash is being fueled by several factors driving investors away from riskier assets, including rising interest rates, the Russian invasion of Ukraine, and inflation.” He continued, “But the impact of plummeting crypto is not confined only to holders of digital tokens. As crypto prices have fallen, so too have the prices of hardware and other equipment commonly used in the digital currency industry for mining and other functions.”
Specifically regarding headwinds related to NVDA, Reiff stated, “As of a June 19 report by tech data analytics firm 3DCenter, AMD's current-generation graphics cards, also called GPUs, sell for about 92% of MSRP. That's a 10 percentage-point decline in under a month. NVIDIA's comparable GPUs have also dropped, but at a slower rate.”
Regarding the relation between crypto mining and GPU sales, he said, “GPUs have been used in the process of mining virtual currency tokens and have been in short supply at times during the crypto boom. Demand for GPUs may fall if investors turn away from cryptocurrencies or if energy-conscious crypto developers increasingly seek more efficient ways of generating new tokens.” But, as he states, NVDA has a chance to bounce back from this recent sell-off because, “As interest in GPUs for cryptocurrency mining wanes, customers seeking these products for other applications, including gaming, may drive demand instead. That may favor Nvidia's products. Some rankings have placed NVIDIA GPUs higher on best-seller lists for gaming compared with other makers.”
This sentiment is shared by Bank of America securities analyst, Vivek Arya. Even as poor crypto-related demand could hurt NVDA GPU sales moving forward, Bhorgaraju highlighted the recently expressed bullish outlook for NVDA by Arya, who recently listed NVDA as a top pick in the semiconductor industry.
Regarding Bank of America’s most bullish semi selections, Arya said, “Our top picks serve end-markets where we expect spending/content growth drivers to be most resilient, such as in cloud computing/AI, high-end industrial, EV/advanced driver assist systems and in rising chip complexity.”
Nicholas Ward is a Senior Investment Analyst at Wide Moat Research. He has spent the last 8 years writing about the stock market at various publications, including Seeking Alpha, The Street, Forbes Real Estate Investor, Sure Dividend, The Dividend Kings, iREIT, Safe High Yield, and The Intelligent Dividend Investor.
In other words, NVDA’s leading position in several areas of the market the continue to benefit from secular tailwinds, despite the macro pressures that exist in the current marketplace, should continue to drive growth and therefore, share upward price movement, over the longer-term.
Bhorgaraju concluded her bullish article by saying, “Nvidia is expected to face near-term headwinds due to macro challenges, but most of the Wall Street analysts continue to be optimistic about the company’s growth prospects in the years ahead. This is based on the strong demand in the firm's key end-markets, including gaming, data centers, automotive, AI applications, and the multiverse.”
Overall, the majority of credible authors and analysts that Nobias tracks offer a similar bullish sentiment for NVDA shares. 84% of recent article published by credible (4 and 5-star rated) authors have expressed a “Bullish” bias for NVDA shares.
Right now, the average price target that the credible Wall Street analysts that we track (once again, only individuals with 4 or 5-star ratings) have on NVDA shares is $254.78. Today, NVDA trades for $145.23. Relative to this share price, that $254.78 average analyst price target represents upside potential of approximately 75.4%.
Disclosure: Nicholas Ward is long NVDA. Nicholas Ward wrote this article for Nobias at their request with a view of giving investors a balanced perspective based on the writings of Nobias highly rated analysts and bloggers. Nobias has no business relationship with any company whose stock is mentioned in this article and does not have a position in this stock.
Additional disclosure: All content is published and provided as an information source for investors capable of making their own investment decisions. None of the information offered should be construed to be advice or a recommendation that any particular security, portfolio of securities, transaction, or investment strategy is suitable for any specific person. The information offered is impersonal and not tailored to the investment needs of any specific person.
Disclaimer: The Nobias star rating is based on past performance results and is not an indicator of future results. These past performance returns do not represent returns that any investor actually earned. Assumptions made include the ability to purchase the stocks recommended by the author under liquid markets where the transaction would be at the market price for the day. In reality, loss in liquidity may have a material impact on the returns that actually may have been earned. Further, returns are calculated without any including transaction costs, management fees, performance fees or expenses, or reinvestment of dividends and other income. This information is provided for illustrative purposes only.
MU with Nobias Technology: Case Study on Micron Technology
Micron Technology, a large-cap player in the semiconductor space, is down by 42.27% year-to-date thus far. Micron just reported its fiscal 2022 third quarter results and coming into the report, the credible authors and analysts that the Nobias algorithm tracks were very bullish on shares. Despite immense fundamental volatility and recent share price weakness, MU has posted significant outperformance over the last 5 and 10-year periods. Therefore, we wanted to analyze the stock with the Q3 results in mind.
It’s been a rough year for the semiconductor industry. Year-to-date, the iShares Semiconductor ETF (SOXX) is down by 36.79%. Investors fear that a macro economic slowdown will hurt semiconductor demand. And while it’s unclear whether or not the macroeconomic weakness that we’ve seen throughout 2022 will result in a recession, and if so, how deep or long lasting the economic plight will be, in the near-term, the semiconductor space has been hampered by supply chain issues related to the COVID-19 pandemic which has created a perfect storm of sorts, with regard to the negative sentiment surrounding this industry.
Micron Technology, a large-cap player in the semiconductor space, is down by 42.27% year-to-date thus far. Micron just reported its fiscal 2022 third quarter results and coming into the report, the credible authors and analysts that the Nobias algorithm tracks were very bullish on shares. Despite immense fundamental volatility and recent share price weakness, MU has posted significant outperformance over the last 5 and 10-year periods. Therefore, we wanted to analyze the stock with the Q3 results in mind.
Micron is a very cyclical company - from a fundamental perspective - with its earnings-per-share showing incredible volatility as broader semiconductor cycles rise and fall. For instance, in 2015, MU generated $2.72/share in EPS, only to see that bottom-line figure fall by approximately 98% to just $0.06/share in 2016. Then in 2017, MU’s earnings-per-share rallied by nearly 8,200%, up to $4.96.share. Micron’s EPS doubled again in 2018, rising to $11.95. However, the company’s earnings were cut in half each of the next two years, falling to just $2.83 by the end of fiscal 2020. In fiscal 2021, MU’s earnings rose by 114%, back up to $6.06/share. And, coming into the Q3 2022 results, the consensus analyst estimate for MU’s bottom-line during the full year this year was $9.43, meaning that Wall Street expects to see 56% growth this year.

MU Jun 2022
Needless to say, this company isn’t for the faint of heart with this sort of fundamental rollercoaster constantly playing out. But, MU has treated investors who have the intestinal fortitude to overlook the volatility and stick with the stock well. Over the last 10 years, MU shares are up more than 722% (well above the 179% gains that the S&P 500 has posted during this same period of time). Now, with the Q3 numbers in hand, we wanted to examine recent reports on the stock to see whether or not this is a dip worth buying.
Patrick Seitz, a Nobias 4-star rated author, recently published an article at Investors.com, titled, “Is Micron Stock A Buy Ahead Of Chipmaker's Earnings Report?” Seitz touched upon Micron’s operations, writing, “Boise, Idaho-based Micron makes two main types of memory chips: DRAM and Nand. DRAM chips act as the main memory in PCs, servers and other devices, working closely with central processing units. Nand flash provides longer-term data storage.”
Regarding the company’s revenue balance, he stated, “Dynamic random-access memory, or DRAM, accounted for 73% of Micron's revenue in its fiscal second quarter. Nand flash memory accounted for 25% of its revenue during the period.” And, regarding MU’s industry competition, Seitz wrote, “In DRAM chips, MU stock competes with South Korea's Samsung Electronics and SK Hynix. In Nand flash chips, Micron competes with Samsung, SK Hynix, Kioxia and Western Digital (WDC).”
Looking back at MU’s Q2 results, Seitz said, “Late on March 29, Micron easily beat Wall Street's targets for its fiscal second quarter and guided higher for the current period.” He continued, “It was the company's fifth straight quarter of triple-digit percentage gains in earnings per share.”
More recently, on 5/12/2022, Seitz noted that the company held an Investor Day and he went on to highlight the company’s future-looking commentary. Seitz wrote, “Executives also discussed the company's strategy for expanding its share of the memory and storage markets through technology leadership. It sees automotive and data-center business driving its growth.” He also noted a plan by the company to “entice” customers to sign 3-year deals for DRAM chips, which would help to smooth out some of the aforementioned fundamental volatility that MU has been known for in the past.
Lastly, Seitz put a spotlight on shareholder returns, saying, “In addition, Micron raised its quarterly dividend by 15% to 11.5 cents per share. The chipmaker also is accelerating its share repurchasing.” Looking ahead to the company’s Q3 report, he stated, “For the current quarter, Micron predicted adjusted earnings of $2.46 a share on sales of $8.7 billion. That would translate to year-over-year growth of 31% in earnings and 17% in sales. Wall Street had projected earnings of $2.24 a share on sales of $8.13 billion.”
But, even with all of this in mind, Seitz’s technical analysis concluded that, “Micron stock is not a buy right now.” He said, “Micron stock is trading below its 50-day and 200-day moving average lines.” He continued, “It needs to form a new base in the right market conditions before setting a potential buy point.”
Growth at a Good Price, a Nobias 5-star rated author, also recently published an article highlighting their opinion on MU stock heading into the third quarter report. Growth at a Good Price wrote that some of the negative sentiment surrounding MU shares recently was due to falling prices seen on the DRAM exchange; however, they note, “One big reason why I'd trust Micron's guidance over RAM price charts is because Micron does not make most of its money selling to consumers. “ The author continued: “Instead, it makes money selling to:
Phone manufacturers;
Data centers;
Computer manufacturers;
Other semi companies.
Micron divides its revenue by segment in its quarterly presentations. For the most recent quarter, the breakdown was:
$3.46 billion in compute and networking;
$1.87 billion in mobile;
$1.17 billion in storage;
$1.27 billion in embedded.”
Another reason that MU’s share price is down is because investors widely view the company’s products as commodities and therefore, it’s often believed that MU doesn’t have a defensible competitive moat. But, Growth at a Good Price addressed this concern stating, “Micron is working toward making its products less "commodity-like" in the future. In pure economic terms, RAM and Flash storage are commodities, but Micron is working on differentiating its products. It is tailoring its DDR5 memory to be low power and high-speed, and it has the fastest discrete graphics memory around. As memory becomes more specialized, it may cease to be a commodity.”
Furthermore, looking backwards at the trailing 12 month period, Growth at a Good Price highlighted MU’s “incredible results” writing that the stock is “Micron stock is already outrageously cheap”.
Regarding the company’s financials, they wrote: “In the most recent 12-month period, Micron delivered:
$31 billion in revenue, up 32%;
$10.4 billion in EBIT, up 187%;
$9 billion in net income, up 182%;
$15 billion in operating cash flow ("OCF"), up 62%;
$4.34 in free cash flow ("FCF") per share, up 330%.”
The author also noted, “On top of that, margins were high. For example, with $9 billion in net income on $31 billion in sales, you get a 29% net margin. So, Micron is very profitable.”
Growth at a Good Price also analyzed MU’s balance sheet and ultimately concluded, “From these balance sheet metrics we get a 0.125 debt to equity ratio and a 3.11 current ratio, suggesting high solvency and liquidity. So, Micron is not at risk of going bankrupt or experiencing liquidity problems.” The author then touched upon MU’s 6.8x adjusted price-to-earnings ratio and stated, “At this point, Micron is approaching liquidation value. So, this is one stock that every value investor should take a serious look at.”
In the end, this author offered a much more bullish conclusion than Seitz, writing, “The bottom line on Micron is that it's a combination of growth and value that you rarely see side by side in the same stock. This is a company that is growing earnings at 180%, yet has a P/E ratio barely above 5. It certainly looks like a good value. And if its efforts at product differentiation and long term contract pricing succeed, it will prove to be one.”
When Micron reported earnings after the market’s closing bell on 6/30/2022, the company posted revenue of $8.64 billion, which was in-line with Wall Street’s consensus estimate and non-GAAP earnings-per-share of $2.59, which beat consensus estimates by $0.15/share. The company highlighted its cash flow generation stating that it produced “Operating cash flow of $3.84 billion versus $3.63 billion for the prior quarter and $3.56 billion for the same period last year”.
Nicholas Ward is a Senior Investment Analyst at Wide Moat Research. He has spent the last 8 years writing about the stock market at various publications, including Seeking Alpha, The Street, Forbes Real Estate Investor, Sure Dividend, The Dividend Kings, iREIT, Safe High Yield, and The Intelligent Dividend Investor.
Micron’s CEO, Sanjay Mehrotra, began the press release stating: “Micron delivered record revenue in the fiscal third quarter driven by our team’s excellent execution across technology, products and manufacturing. Recently, the industry demand environment has weakened, and we are taking action to moderate our supply growth in fiscal 2023. We are confident about the long-term secular demand for memory and storage and are well positioned to deliver strong cross-cycle financial performance.”
The company provided guidance for the upcoming fourth quarter as well, calling for sales of approximately $7.2 billion (plus/minus $400 million), gross margin of 42.5% (plus/minus 1.5%), operating expenses of $1.05 billion (plus/minus $25 million), and non-GAAP earnings-per-share of $1.63 (plus/minus $0.20/share). Micron shares traded down 1.50% during the after hours in response to this news.
However, looking at the opinions expressed by the credible authors and analysts that Nobias tracks, it’s clear that the vast majority of them remain very bullish on MU shares. 95% of recent articles published by the credible authors that we track have expressed “Bullish” sentiment for MU. Right now, the average price target being applied to MU shares by the credible Wall Street analysts that we track is $88.57. Today, MU trades for $55.28, meaning that this average price target implies upside potential of approximately 60%.
Disclosure: Nicholas Ward has no MU position. Nicholas Ward wrote this article for Nobias at their request with a view of giving investors a balanced perspective based on the writings of Nobias highly rated analysts and bloggers. Nobias has no business relationship with any company whose stock is mentioned in this article and does not have a position in this stock.
Additional disclosure: All content is published and provided as an information source for investors capable of making their own investment decisions. None of the information offered should be construed to be advice or a recommendation that any particular security, portfolio of securities, transaction, or investment strategy is suitable for any specific person. The information offered is impersonal and not tailored to the investment needs of any specific person.
Disclaimer: The Nobias star rating is based on past performance results and is not an indicator of future results. These past performance returns do not represent returns that any investor actually earned. Assumptions made include the ability to purchase the stocks recommended by the author under liquid markets where the transaction would be at the market price for the day. In reality, loss in liquidity may have a material impact on the returns that actually may have been earned. Further, returns are calculated without any including transaction costs, management fees, performance fees or expenses, or reinvestment of dividends and other income. This information is provided for illustrative purposes only.
MO with Nobias Technology: Case Study on Altria
Altria (MO) has been known as a very reliable, defensive, dividend paying stock in the market for decades. The company is on a 52-year annual dividend increase streak. And, throughout much of 2022, MO shares have provided investors with a relatively safe haven in the markets, outperforming the S&P 500 by a wide margin (on a year-to-date basis, the S&P 500 is down 18.45% and Altria shares are down 9.53%). However, last week things changed, with the S&P 500 rising by 4.36% while MO shares fell by 5.01%. In recent days, MO has seen a slew of negative headlines, from an analyst downgrade to news that the FDA was banning products important to its long-term growth prospects. MO shares hit 52-week lows this week and yet, the credible authors and analysts that Nobias tracks continue to attach very bullish sentiment to MO shares.
Altria (MO) has been known as a very reliable, defensive, dividend paying stock in the market for decades. The company is on a 52-year annual dividend increase streak. And, throughout much of 2022, MO shares have provided investors with a relatively safe haven in the markets, outperforming the S&P 500 by a wide margin (on a year-to-date basis, the S&P 500 is down 18.45% and Altria shares are down 9.53%). However, last week things changed, with the S&P 500 rising by 4.36% while MO shares fell by 5.01%. In recent days, MO has seen a slew of negative headlines, from an analyst downgrade to news that the FDA was banning products important to its long-term growth prospects. MO shares hit 52-week lows this week and yet, the credible authors and analysts that Nobias tracks continue to attach very bullish sentiment to MO shares.
With MO’s recent sell-off in mind, Mike Robinson, a Nobias 5-star rated author, recently put a spotlight on a report from Morgan Stanley’s analyst, Pamela Kaufman, who downgraded Altria to “underweight” which sent the stock falling 7%.
Robinson wrote, “Kaufman also reduced the price target for Altria from $54 to $50”. In her note, Kaufman said, “MO shares have outperformed the S&P 500 by 27% YTD, and when adjusting for the 7% decline in ABI’s price in USD, MO’s core business is +29% YTD. Market may shift to a more defensive posture, but we view risk-reward as biased to the downside due to the combination of short-term fundamental pressures with our longer-term worries about MO’s cigarettes portfolio, RRP offering and PM’s possible SWMA acquisition.”

MO Jun 2022
Chris Morris, a Nobias 4-star rated author, also covered the Morgan Stanley downgrade, noting that the report highlights the threat of inflation and the pressure that it is putting on Altria’s customers, as a primary threat to the company’s fundamental growth in the near-term.
Morris wrote, “Morgan Stanley believes there is an inverse relationship between gas prices and cigarette sales—and gas prices on Wednesday were averaging $4.95 nationwide, according to AAA.” What’s more, the end of the COVID-19 pandemic period is seen as a potential demand headwind for cigarette sales.
Morris said, “The stress of the COVID pandemic was widely seen by analysts as the primary reason for a major comeback year for cigarettes in 2020, the first increase in cigarette sales in two decades. The Federal Trade Commission's annual Cigarette Report found 203.7 billion cigarettes sold in 2020, a 0.4% increase from 202.9 billion in 2019.”
Tradevestor, a Nobias 5-star rated author on Seeking Alpha, recently published a report which noted the Morgan Stanley downgrade, but explained why that author remains bullish on Altria, all the same. Tradevestor wrote, “The downgrade is citing macroeconomic conditions as the primary reason. However, Altria is likely to withstand the pressure from these for two reasons: pricing-power and inelasticity.” The author continued, saying, “Despite being up 14% YTD while the S&P 500 (SPY) is down nearly 13%, Altria is still trading at a forward multiple of 11 and yields 6.70%. That tells us that quite a bit of micro, macro, and regulatory risks are priced into the stock. There is clearly not much optimism when you put those numbers together.”
In other words, the recent out-performance that Altria has generated doesn’t mean that the stock is trading with a sky-high valuation. Altria’s ~11x price-to-earnings multiple is still far below the S&P 500’s price-to-earnings multiple, which currently sits at 19.77x, according to multpl.com.
With regard to the recent analyst downgrade and MO’s share price weakness, Tradevestor said, “We will stay invested heavily in Altria and continue to add on weakness”. They concluded their article stating, “For long-term investors, staying in through thick and thin with high-yielding stocks of good businesses has almost always paid off.”
Altria’s high dividend yield remains one of the primary reasons that several of the credible authors who have posted reports recently remain bullish on MO shares. Altria currently yields 8.29%. And, as Nobias 5-star rated author, Dividend Power, points out, the company has a history of reliable dividend growth as well.
In a recent article at Seeking Alpha, Dividend Power wrote, “Additionally, Altria increased the dividend by 4.7% in 2021. The trailing dividend growth rate is 8.42% CAGR in the past 5 years and 8.34% in the past 10 years.” Tradevestor also highlighted MO’s strong dividend yield and dividend growth outlook. In this article, they analyzed Altria’s forward dividend growth prospects for 2022 writing: “Altria goes ex-dividend for 90 cents a share on June 14th, and it will be the 4th straight quarter of paying 90 cents. That means only one thing for Altria investors: a dividend increase announcement is expected in August.
Current forward EPS guidance is between $4.79 and $4.93. Let's be pessimistic and pick $4.80.
Altria has a stated policy/goal of paying 80% of its earnings in the form of dividends. 80% of $4.80 is $3.84 in annual dividend per share. That's 96 cents per quarter, a handsome 6.67% boost to the already attractive yield of 6.70%.”
Ultimately, when concluding their piece, Dividend Power expressed a bullish outlook that was similar to Tradevestor’s. Dividend Power wrote, “Altria is still a play on cigarettes and oral tobacco despite a secular decline due to health concerns, FDA approval process, advertising regulation, and taxes. Altria is trying to grow its smokeless tobacco business but with limited success. However, the company has been able to raise cigarette prices more than offsetting volume declines. Furthermore, the barriers to entry are incredibly high, limiting competition. Hence, investor returns have been relatively good. Investors seeking high yield and dividend growth may find Altria interesting.”
And, as it turns out, relative outperformance (and the threat of mean reversion) alongside the competitive threat that Philip Morris (PM) offers aren’t the only significant headwinds that Altria faces. As Tradevestor said in another recent article, “When it rains, it pours.” They were speaking about headlines that broke late last week from the FDA which says that it is banning the sale of JUUL products in the United States (Altria had previously invested $12.8 billion into JUUL as a way to diversify its revenue stream away from combustible tobacco).
A recent Bloomberg article stated, “The Food and Drug Administration denied authorization to Juul Labs Inc. for all of its products currently marketed in the US, dealing a substantial blow to a company that was briefly a darling among both tobacco giants and Silicon Valley investors.”
A day later, an article from The Hill stated that Altria is challenging the ruling in court and therefore, “A federal appeals court on Friday temporarily blocked the Food and Drug Administration’s order banning the sale of Juul e-cigarettes, giving a reprieve to the company while the court hears more arguments.”
Nicholas Ward is a Senior Investment Analyst at Wide Moat Research. He has spent the last 8 years writing about the stock market at various publications, including Seeking Alpha, The Street, Forbes Real Estate Investor, Sure Dividend, The Dividend Kings, iREIT, Safe High Yield, and The Intelligent Dividend Investor.
At this point, it’s unclear as to what the ultimate legal outcome will be regarding JUUL; however, as Tradevestor says, “We cannot predict the government's next action. We cannot predict the Fed's next action. We certainly cannot predict the war situation in Ukraine. But what we can predict with certainty is 9% compounded annually works out to a pretty satisfactory return over the long run.”
Tradevestor ended their article stating, “Altria's EPS may go down. Or they may increase. But what we can predict is that the company will still continue paying out 80% of what it makes to shareholders. And history so far suggest that the payout increases each year. Heroes are not made in the war field when the enemy just folds under pressure. Heroes are made when salvaging and even winning from a disastrous situation. Running when the chips are down isn't ideal. We are staying invested with Altria and even buying more on such opportunities. Good luck to everyone.”
Overall, when looking at the opinions expressed by the credible authors and analysts that the Nobias algorithm tracks, it appears that the vast majority of them share this bullish sentiment. 92% of recent articles published on Altria have expressed a “Bullish” bias for the stock. And right now the average price target being applied to MO shares by the credible Wall Street analysts that we track is $56.50/share. After selling off more than 5% last week on several negative headlines, Altria shares are trading for $43.40. Therefore, that average credible analyst price target implies upside potential of approximately 30.2%.
Disclosure: Nicholas Ward is long MO. Nicholas Ward wrote this article for Nobias at their request with a view of giving investors a balanced perspective based on the writings of Nobias highly rated analysts and bloggers. Nobias has no business relationship with any company whose stock is mentioned in this article and does not have a position in this stock.
Additional disclosure: All content is published and provided as an information source for investors capable of making their own investment decisions. None of the information offered should be construed to be advice or a recommendation that any particular security, portfolio of securities, transaction, or investment strategy is suitable for any specific person. The information offered is impersonal and not tailored to the investment needs of any specific person.
Disclaimer: The Nobias star rating is based on past performance results and is not an indicator of future results. These past performance returns do not represent returns that any investor actually earned. Assumptions made include the ability to purchase the stocks recommended by the author under liquid markets where the transaction would be at the market price for the day. In reality, loss in liquidity may have a material impact on the returns that actually may have been earned. Further, returns are calculated without any including transaction costs, management fees, performance fees or expenses, or reinvestment of dividends and other income. This information is provided for illustrative purposes only.
REV with Nobias Technology: Case Study on Revlon
Recently, iconic consumer brand Revlon (REV) announced that it was filing for bankruptcy. The company’s press release stated that REV was voluntarily filing for Chapter 11 reorganization, stating: “The Chapter 11 filing will allow Revlon to strategically reorganize its legacy capital structure and improve its long-term outlook, especially amid liquidity constraints brought on by continued global challenges, including supply chain disruption and rising inflation, as well as obligations to its lenders.”
Recently, iconic consumer brand Revlon (REV) announced that it was filing for bankruptcy. The company’s press release stated that REV was voluntarily filing for Chapter 11 reorganization, stating: “The Chapter 11 filing will allow Revlon to strategically reorganize its legacy capital structure and improve its long-term outlook, especially amid liquidity constraints brought on by continued global challenges, including supply chain disruption and rising inflation, as well as obligations to its lenders.”
Within the release, Debra Perelman, Revlon's President and Chief Executive Officer was quoted saying: Today’s filing will allow Revlon to offer our consumers the iconic products we have delivered for decades, while providing a clearer path for our future growth. Consumer demand for our products remains strong – people love our brands, and we continue to have a healthy market position. But our challenging capital structure has limited our ability to navigate macro-economic issues in order to meet this demand. By addressing these complex legacy debt constraints, we expect to be able to simplify our capital structure and significantly reduce our debt, enabling us to unlock the full potential of our globally recognized brands. We are committed to ensuring the reorganization is as seamless as possible for our key stakeholders, including our employees, customers and vendors, and we appreciate their support during this process.”
Revlon (REV) shares hit 52-week lows of $1.09/share with news of this bankruptcy swirling. However, since making those new lows, REV shares soared more than 800% to recent highs in the $9.00/share area. Today, REV trades for $7.20/share, still up significantly from its post-bankruptcy headline bottom. And now, with shares experiencing significant volatility, investors and traders alike are questioning whether or not this bounceback is real, or if REV is going to prove to be yet another precarious “meme stock”.

REV Jun 2022
On June 10th, Nobias 5-star rated author, Mike Robinson highlighted Revelon’s bankruptcy issues, stating: “Revlon Inc, a cosmetics manufacturer, is preparing for Chapter 11 protection, according to the Wall Street Journal, citing sources familiar with the matter. Revlon shares dropped 46% and did not respond immediately to Reuters’ request for comment.
Last week, the WSJ reported that lipstick company Lipstick Maker began negotiations with lenders to avoid bankruptcy due to looming debt maturities. Revlon’s long-term debt was $3.31 Billion as of March 31st.” Nobias 4-star rated author, Shrey Dua, also touched upon the stock’s bankruptcy proceedings in an article published at Investor Place on June 14th.
Dua wrote, “Last Friday, The Wall Street Journal reported the company was looking to reduce or restructure its $4.3 billion debt portfolio.” He continued, “The news came as something of a surprise to investors, especially given Revlon’s relatively strong May 7 earnings call. The beauty company announced 8% net sales growth, to $445 million for the quarter ended in March. The company even reported a net profit of $24 million. This represents the company’s best first quarter adjusted earnings before interest, taxes, depreciation and amortization (EBITDA) in six years.”
Dua noted that the company’s -$1.14 earnings-per-share print during its recent quarterly report beat Wall Street’s consensus estimate of -$1.66/share, writing, “While the company was still a ways away from wiping its debt clear, the news was at least a bullish indicator for REV investors.”
Dua also touched upon the stock’s recent rally, in the face of the bankruptcy news. He said that the stock’s strong upside move appears to be due to a short-squeeze, stating, “Indeed, Revlon ranked in the top 15 of Fintel’s short squeeze leaderboard this week.”
Regarding investors’ puzzling, yet bullish rationale with REV shares, Dua said, “Short squeezes occur when a number of investors buy up a stock with a strong short interest, forcing short sellers to sell their holdings early to avoid theoretically unlimited losses. This is largely what happened in last year’s meme-stock boom as companies like GameStop (NYSE:GME) and AMC (NYSE:AMC) saw their share value skyrocket for seemingly no reason at all.”
Other credible Nobias authors have noticed this trend as well. With regard to the idea of a stock skyrocketing “for seemingly no reason at all” as Dua wrote, Nobias 4-star rated author, Veronika Bondarenko, recently posed the question, “Is Revlon The New Meme Stock?” She compared the massive retail investor interest and the post-bankruptcy rally that we’ve seen REV experience to Hertz (HTZ), which saw a similar story play out in 2020-2021.
With regard to the wallstreetbets crowd on Reddit, who she says have been driving demand for REV shares, Bondarenko wrote “Many were pointing toward Hertz (HTZZW) , which filed for bankruptcy in 2020 and saw a similar spike in the following period.”
Regarding the “meme stock” trend, Bondarenko quoted Ihor Dusaniwsky, managing director at research firm S3 Partners, in her article. Dusaniwsky said, "The recent price moves are due to long buying and selling and not short selling and covering – in other words, a meme stock.”
Bondarenko continued, “With Revlon shares down more than 51% year-over-year, it is still too early to tell whether this type of burst is a momentary flash in the pan or something that will continue.” She wrote, “Names that invoke nostalgia are the most likely candidates to see a turnaround. But at the same time, meme stocks tend to fizzle out by their definition while Revlon's difficulties appear to be persistent.”
And, looking at the Hertz story…while it’s true that HTZ shares saw a significant rally, from the $15/$16 area soon after its bankruptcy was announced to highs in the $35.00 area during late 2021, today HTZ shares trade for $17.47, meaning that many investors who bought into the stock’s “meme” momentum now find themselves underwater on their investments.
“Meme stock” or not, REV’s bullish short-term trajectory is still in place. Bailey Lipschultz, a Nobias 4-star rated author recently published an article at BNN Bloomberg which highlighted the stock’s surging momentum.
On June 22, 2022, Lipschultz said, “Traders piled into shares of Revlon Inc., driving its gains from a record low to 800% as individual investors looked to strike a quick profit, while ignoring the fundamentals of the troubled cosmetics giant.”
Nicholas Ward is a Senior Investment Analyst at Wide Moat Research. He has spent the last 8 years writing about the stock market at various publications, including Seeking Alpha, The Street, Forbes Real Estate Investor, Sure Dividend, The Dividend Kings, iREIT, Safe High Yield, and The Intelligent Dividend Investor.
Lipschultz continued, “The stock surged as much as 63% on Wednesday, bringing gains from an all-time low to 800% as trading volume continued to soar past recent trends. More than 101 million Revlon shares have traded on average each day since bottoming -- about 570 times the average daily volume in the past year prior to its boom.” He stated, “Retail traders have been helping to drive gains, piling in nearly $18 million over the past week, data from Vanda Research show.”
And, highlighting the risks that these investors are taking on, Lipschultz continued, “Common stockholders have some of the weakest claims on a company’s assets in bankruptcy court, standing in line behind lenders, bondholders and other creditors who typically must be fully repaid before shareholders get anything. The proceedings often leave the shares worthless.”
It is unclear how this story is going to end, but Lipschultz points out that REV could be in for a HTZ-like story in the near-term, writing “Revlon’s following among retail traders armed with commission-free apps has picked up steam in recent days, with the ticker trending on popular chatroom Stocktwits and ranking among among the most-mentioned companies on Reddit’s WallStreetBets forum alongside GameStop Corp. Revlon was the most-bought asset on Fidelity’s platform in the first half hour with buys outpacing sell orders.”
Right now the credible Wall Street analysts that Nobias tracks do not offer a consensus price target for Revlon shares. However, when looking at recent reports from credible authors that the Nobias algorithm tracks, 81% of them have expressed a “Bullish” bias for shares.
Disclosure: Nicholas Ward has no REV position. Nicholas Ward wrote this article for Nobias at their request with a view of giving investors a balanced perspective based on the writings of Nobias highly rated analysts and bloggers. Nobias has no business relationship with any company whose stock is mentioned in this article and does not have a position in this stock.
Additional disclosure: All content is published and provided as an information source for investors capable of making their own investment decisions. None of the information offered should be construed to be advice or a recommendation that any particular security, portfolio of securities, transaction, or investment strategy is suitable for any specific person. The information offered is impersonal and not tailored to the investment needs of any specific person.
Disclaimer: The Nobias star rating is based on past performance results and is not an indicator of future results. These past performance returns do not represent returns that any investor actually earned. Assumptions made include the ability to purchase the stocks recommended by the author under liquid markets where the transaction would be at the market price for the day. In reality, loss in liquidity may have a material impact on the returns that actually may have been earned. Further, returns are calculated without any including transaction costs, management fees, performance fees or expenses, or reinvestment of dividends and other income. This information is provided for illustrative purposes only.
F with Nobias Technology: Case Study on Ford
Ford (F) shares have suffered mightily throughout 2022, falling by 48.42% on a year-to-date basis thus far. Analysts believe that automakers are square in the crosshairs of many of the major macro headwinds at play these days. Automakers are struggling with supply chain issues, the semiconductor shortage, rising interest rates, and soaring raw material costs. However, there are many who believe that these issues are short-term in nature and therefore, the fear related to them in the market today has created attractive opportunities for long-term investors. Ford appears to fall into this category, with an average credible analyst price target that implies immense upside potential.
Ford (F) shares have suffered mightily throughout 2022, falling by 48.42% on a year-to-date basis thus far. Analysts believe that automakers are square in the crosshairs of many of the major macro headwinds at play these days. Automakers are struggling with supply chain issues, the semiconductor shortage, rising interest rates, and soaring raw material costs. However, there are many who believe that these issues are short-term in nature and therefore, the fear related to them in the market today has created attractive opportunities for long-term investors. Ford appears to fall into this category, with an average credible analyst price target that implies immense upside potential.
In recent quarters, Ford has shown strong growth, especially from its electronic vehicle (EV) segment. Chris Lau, a Nobias 4-star rated author, covered Ford’s EV success in a recent article titled, “EV Play: GM or Ford?” In his report, Lau stated, “Last week, Ford posted EV sales doubling at around 222%. The astute investor will look at the unit sales instead. It sold 6,254 units in the month. In addition, Mach-E sales rose by 166% Y/Y.” He continued, “Ford posted U.S. sales of 154,461 vehicles in May 2022. Sales fell by 4.5%, compared to a 10.5% decline in April 2022.”
Lau noted that General Motors (GM) has taken a different path than names like Ford or Tesla (TSLA) in the EV space, cutting prices on its cars to drive consumer demand. It’s too soon to tell whether or not GM’s alternative path will work; however, in an inflationary environment, where automakers have already having trouble maintaining margins and profit levels, analysts have been wary of discounting maneuvers. Ultimately, Lau concluded, “GM and F stock are both compelling EV plays at these levels.”

F Jun 2022
But, in another recent piece published by a Nobias credible author, a more bearish opinion was offered. Both inflation and supply chain issues continue to hit the automakers, Ford included. And, in a recent article published at Yahoo Finance, Nobias 4-star rated author, Rebecca Bellan, touched upon Ford’s recent headwinds, stating, “Even though Ford has seen record profits and strong demand for electric vehicles like the Mustang Mach-E, rising battery material costs and inflation are erasing any potential profits for the new car, said Ford CFO John Lawler on Wednesday at a conference hosted by Deutsche Bank and reported on by CNBC.” She continued, “This is despite a recent price hike of the Mach-E to offset the effects of inflation.”
Bellan noted that Lawler said that the cost of producing Ford’s EVs has increased by as much as $25,000 per vehicle. This obviously creates margin headaches for the company. And, on top of that, Bellan highlights Ford’s recent recall issues, writing, “This news comes as Ford is in the midst of recalling nearly 49,000 Mach-Es because of a malfunction that could cause overheating of the vehicle's battery high-voltage contactors, which can result in loss of power while driving and cause an accident.”
Bellan continued, “The company said a simple over-the-air update will fix the problem, but if the recalls become more involved than that, it could cost the company millions.” Ballan concluded, touching upon more headwinds that the company is facing, stating, “It's not only on the automaker side that we're seeing challenges meeting commitments emerge. Customers are making payments to Ford Credit, the automaker's vehicle financing arm, later and later, said Lawler, noting that this is another sign of headwinds.” In short, there are no shortages of growth hurdles in front of Ford right now and with that in mind, investors shouldn’t be surprised to see F’s share price down more than 16% during the last month.
Lee Samaha, a Nobias 4-star rated author, also recently published an article highlighting headwinds that Ford faces, though his piece was largely focused on the ongoing issues that the automaker is facing with regard to Chinese production and supply chain concerns.
On June 13th, Samaha wrote, “Shares in vehicle maker Ford Motor Company were down by more than 6% as of midday Monday. The move follows news that China is reimposing COVID-19 restrictions after recently relaxing them and the rise in interest rates in response to a disappointing inflation report on Friday.”
Samaha noted that this report came on the heels of the U.S. inflation report for May, which included 8.6% growth on the Consumer Price Index. Samaha continued, “In response to the inflation report and the news from China, the market took the benchmark U.S 10-year Treasury yield up to 3.3% -- for reference, it started the year at 1.76%. The higher interest rates are, the more expensive it is to borrow money to finance buying large-ticket items like housing and automobiles.”
Samaha wrote, “Rising inflation and rising rates matter to Ford. Inflation pushes up costs, and rising rates choke off demand for vehicles.” Samaha specifically touched upon issues that inflation causes for Ford’s Credit segment, stating, “Rising rates may also put pressure on profitability at Ford Credit. Ford offers vehicle-related financing and leasing activities that help support demand for its vehicles. It's a highly profitable operation, generating $46 billion in earnings before taxes over the last 20 years and $4.7 billion in 2021 alone.”
During recent quarters, Ford Credit’s metrics have remained strong; however, Samaha writes, “with rates rising, it could put pressure on loan losses in the future, particularly given the current low rate.” Ultimately, Samaha provided cautious optimism for Ford shares moving forward; however, the author was quick to highlight the uncertainty surrounding shares (and the broader market) moving forward, stating:
“It's almost impossible to predict inflation and interest rate movements, and they can change course when least expected. Moreover, the lockdowns in China and the war in Ukraine are part of the reasons for the soaring inflation causing rising rates. However, both issues could be resolved in due course, so it's far too early to count Ford as a victim of an inexorably rising rate environment, particularly as underlying demand for vehicles remains strong.”
With regard to that strong demand, Mike Robinson, a Nobias 5-star rated author, recently published an article at the Street Register, which highlighted major investments that Ford is making into its production capabilities to meet consumer needs.
Robinson said, “Ford Motor (NYSE:) Co on Thursday mentioned it can make investments $3.7 billion in meeting crops in Michigan, Ohio and Missouri for manufacturing of each electrical and gasoline-powered automobiles.” He continued, “Ford mentioned $2.3 billion of the entire funding might be spent on EVs, a part of the $50 billion in EV spending by way of 2026 it beforehand outlined.”
Nicholas Ward is a Senior Investment Analyst at Wide Moat Research. He has spent the last 8 years writing about the stock market at various publications, including Seeking Alpha, The Street, Forbes Real Estate Investor, Sure Dividend, The Dividend Kings, iREIT, Safe High Yield, and The Intelligent Dividend Investor.
With specific regard to Ford’s EV production plans, Robinson wrote, “Ford on Thursday mentioned it can make investments $2 billion at three crops in Michigan to extend manufacturing of the brand new F-150 Lightning pickup truck to 150,000 – an motion it beforehand outlined in April – in addition to construct new variations of the Ranger pickup and Mustang sports activities automobile.”
Overall, Robinson stated, “Ford in March mentioned it was boosting its spending on EVs to $50 billion by way of 2026, up from $30 billion beforehand. It additionally mentioned it could run its EV and inner combustion engine (ICE (NYSE:)) companies as separate items in a transfer aimed toward catching EV trade chief Tesla (NASDAQ:).”
61% of recent articles published by credible Nobias authors (only those given 4 and 5-star ratings by our algorithm) have included a “Bullish” bias on shares. However, the credible Wall Street analysts (once again, only those with 4 and 5-star ratings) that we track appear to be much more bullish on Ford shares. Right now, the average price target being applied to F shares by credible analysts is $19.50. Today, F trades for just $11.23. This average price target implies upside potential of approximately 73.6%.
Disclosure: Nicholas Ward has no position in any company mentioned in this article. Nicholas Ward wrote this article for Nobias at their request with a view of giving investors a balanced perspective based on the writings of Nobias highly rated analysts and bloggers. Nobias has no business relationship with any company whose stock is mentioned in this article and does not have a position in this stock.
Additional disclosure: All content is published and provided as an information source for investors capable of making their own investment decisions. None of the information offered should be construed to be advice or a recommendation that any particular security, portfolio of securities, transaction, or investment strategy is suitable for any specific person. The information offered is impersonal and not tailored to the investment needs of any specific person.
Disclaimer: The Nobias star rating is based on past performance results and is not an indicator of future results. These past performance returns do not represent returns that any investor actually earned. Assumptions made include the ability to purchase the stocks recommended by the author under liquid markets where the transaction would be at the market price for the day. In reality, loss in liquidity may have a material impact on the returns that actually may have been earned. Further, returns are calculated without any including transaction costs, management fees, performance fees or expenses, or reinvestment of dividends and other income. This information is provided for illustrative purposes only.
ORCL with Nobias Technology: Case Study on Oracle
Like so many technology stocks in today’s marketplace, Oracle (ORCL) shares were recently down as much as 25% on a year-to-date basis. However, unlike the majority of its peers, who have continued to experience negative momentum and bearish sentiment related to the macro rising interest rate environment, Oracle shares had a nice bounce recently, on the heels of an impressive earnings report. Furthermore, last week Oracle closed on a major acquisition which diversified the company’s revenue stream further into the healthcare arena, which is considered to be a durable growth area of the market.
Like so many technology stocks in today’s marketplace, Oracle (ORCL) shares were recently down as much as 25% on a year-to-date basis. However, unlike the majority of its peers, who have continued to experience negative momentum and bearish sentiment related to the macro rising interest rate environment, Oracle shares had a nice bounce recently, on the heels of an impressive earnings report. Furthermore, last week Oracle closed on a major acquisition which diversified the company’s revenue stream further into the healthcare arena, which is considered to be a durable growth area of the market.
The combination of bullish M&A and a positive earnings surprise caused Oracle shares to rally more than 9% on 6/14/2022. And, looking at the bullish bias expressed by the vast majority of credible authors and the consensus price target amongst the credible Wall Street analysts tracked by the Nobias algorithm, it appears that ORCL shares may have more room to run.
A potential growth catalyst for Oracle moving forward has to do with its recent $28 billion acquisition of Cerner (which closed on 6/8/2022), which provides the company with a strong foothold in the electronic healthcare records business.
Ron Miller, a Nobias 4-star rated author, recently published an article highlighting the official close of that deal. In his article, Miller quoted Holger Mueller, an analyst at Constellation Research, who had this to say about the Cerner acquisition when the deal was originally announced: “It’s a smart move by Oracle. It cements Oracle technology even deeper into healthcare, and brings a lot of current and especially future work load to Oracle Cloud. Not to mention that Oracle is buying into the largest and fastest-growing vertical industry.” Miller continued, “Cerner certainly has the potential to do that, but it depends on how the two companies fit together in the end, and if Oracle can take all of that market potential and turn it into a viable business inside Oracle.”
There are always uncertainties with large scale M&A like this; however, what investors can know for sure is that this $28 billion deal is closed and therefore, at the very least, Oracle has another growth market to tap into moving forward.
With regard to the potential strength/size of this growth potential, in a recent article, Vladimir Dimitrov, a Nobias 4-star rated author, stated, “During the last conference call, Larry Ellison called healthcare "the largest industry on Earth" and it is also a major pillar for Oracle's strategy in ERP and HCM fields.” With that in mind, coming into Oracle’s fiscal Q4 report, Dimitrov concluded his article by highlighting the stock’s recent sell-off and re-confirming his long-term bullish outlook.
Dimitrov wrote, “Oracle has significantly outperformed the broader market and most of its peers since I first explained why high quality businesses are not necessarily expensive. The recent sell-off was at odds with the company's strengthening competitive positioning and does not appear to have been driven by fading momentum trade, which has likely brought down valuations of many companies within the sector on a more permanent basis. That is why, I intend take advantage of these developments and add to my current long position in the company.”
When Oracle reported its Q4 results on 6/13/2022, Oracle beat Wall Street’s expectations on both the top and bottom lines. Stephen Guilfoyle, a Nobias 4-star rated author, covered these results in an article at The Street. Guilfoyle broke down ORCL’s fundamental results, saying, “For the firm's fiscal fourth quarter, Oracle posted adjusted EPS of $1.54 (GAAP EPS: $1.16) on revenue of $11.84B. Both top and bottom line performance beat Wall Street, while sales grew 5.4% (+10% in constant currency) year over year.” He continued, “Behind the headlines, Total Q4 Cloud Revenue, including IaaS (Infrastructure as a Service) and SaaS (Software as a Service) amounted to $2.9B, up 19%, 22% in constant currency. Infrastructure Cloud Revenue (IaaS) increased 36%, 39% in constant currency. Fusion ERP Cloud Revenue (SaaS) increased 20%, 23% in constant currency. NetSuite ERP Cloud (SaaS) Revenue increased 27%, 30% in constant currency.”
Guilfoyle highlighted Oracle’s balance sheet at the end of the quarter, writing, “As of May 31, 2022, Oracle had a net cash position of $21.902B on the books. This is down a bit since February, but with a nearly equal increase in accounts receivable. This left current assets roughly unchanged at $31.633B.” He continued, “This measures very well against current liabilities of $19.511B for a current ratio of 1.62.”
Nicholas Ward is a Senior Investment Analyst at Wide Moat Research. He has spent the last 8 years writing about the stock market at various publications, including Seeking Alpha, The Street, Forbes Real Estate Investor, Sure Dividend, The Dividend Kings, iREIT, Safe High Yield, and The Intelligent Dividend Investor.
Guilfoyle noted that Oracle did not provide forward guidance during the Q4 report; however, he said that management highlighted their future outlook during the Q4 conference call. Regarding this commentary, Guilfoyle stated, “For the current quarter, Oracle sees adjusted EPS in a range spanning from $1.09 to $1.13. That would be up from the year ago comp of $1.03. The firm also sees revenue growth of 20% to 22%, which would put sales in a range of $11.64B to $11.83B. Management also projected 30% cloud growth for the full year coming.”
It’s also important to note that ORCL’s success on the bottom-line has directly translated to higher shareholder returns. On 6/13/2022, Oracle announced that it was raising its quarterly dividend by 18.5%, from $0.27/share to $0.32/share. Overall, 85% of recent reports that have been published by the credible authors that we track have expressed a “Bullish” bias when it comes to ORCL shares.
The average price target being applied to Oracle by the credible Wall Street analysts that Nobias tracks is currently $84.71. Today, ORCL shares trade for $70.47/share. Therefore, with that average price target in mind, the aggregate opinion of credible analysts points towards upside potential of approximately 20.2%.
Disclosure: As of 6/15/2022, Nicholas Ward has no ORCL position. Nicholas Ward wrote this article for Nobias at their request with a view of giving investors a balanced perspective based on the writings of Nobias highly rated analysts and bloggers. Nobias has no business relationship with any company whose stock is mentioned in this article and does not have a position in this stock.
Additional disclosure: All content is published and provided as an information source for investors capable of making their own investment decisions. None of the information offered should be construed to be advice or a recommendation that any particular security, portfolio of securities, transaction, or investment strategy is suitable for any specific person. The information offered is impersonal and not tailored to the investment needs of any specific person.
Disclaimer: The Nobias star rating is based on past performance results and is not an indicator of future results. These past performance returns do not represent returns that any investor actually earned. Assumptions made include the ability to purchase the stocks recommended by the author under liquid markets where the transaction would be at the market price for the day. In reality, loss in liquidity may have a material impact on the returns that actually may have been earned. Further, returns are calculated without any including transaction costs, management fees, performance fees or expenses, or reinvestment of dividends and other income. This information is provided for illustrative purposes only.
OPEN with Nobias Technology: Case Study on Opendoor Technologies
2022 has been a terrible year for speculative growth stocks. Many former market darlings in the disruptive growth space are trading for just a fraction of what they were worth a year ago. One such company is Opendoor Technologies (OPEN), which fell 14.5% during Friday’s trading session (on the heels of the most recent inflation numbers), pushing its stock price down to levels approximately 77.5% below its all-time highs.
With inflation data coming in at levels that investors haven’t seen since the early 1980’s, speculatively valued growth stocks continue to suffer, due to fears of rising interest rates. As rates rise, the risk premiums that investors are willing to pay for equities tend to fall because of their relative attractiveness to risk-free returns (the interest rates paid by fixed income investments).
With that being said, 2022 has been a terrible year for speculative growth stocks. Many former market darlings in the disruptive growth space are trading for just a fraction of what they were worth a year ago. One such company is Opendoor Technologies (OPEN), which fell 14.5% during Friday’s trading session (on the heels of the most recent inflation numbers), pushing its stock price down to levels approximately 77.5% below its all-time highs.
Samuel Smith, a Nobias 4-star rated author, recently touched upon Opendoor’s significant sell-off and the long-term opportunity that it has created for investors in an article titled, “I Don't Often Buy Tech Stocks, But When I Do I Buy 3 That Could Change The World”.
Smith notes that, “Valuations in the space have become attractive in recent months thanks to the ongoing severe bear market in tech/high growth stocks.” He continues, saying, “Real Estate constitutes the largest sector of the United States’ economy with the GDP value added of $1.898 trillion accounting for 13% of the national GDP. It is also one of the ripest sectors for technological disruption as there are a lot of lingering inefficiencies and archaic practices in the industry. As a result, the growth runway potential for PropTech companies is immense.”

OPEN Jun 2022
Smith highlights his bull thesis for OPEN in the property tech industry, stating: “One of our favorite opportunities in this space is OPEN. Buying a home has long been viewed as the cornerstone of the American Dream, but today it is getting harder than ever to achieve. Between soaring home prices, the threat of rising interest rates, and lingering costly inefficiencies associated with the process (such as the hefty realtor fees and other burdensome shopping and closing processes and fees), home buying and selling remains a giant headache.
These hassles become even more glaring when placed in the modern context of commerce, where the internet, mobile applications, consumer data, and stellar customer service are making the shopping and selling experiences easier, faster, and - in many cases - cheaper than ever. Real estate has been left behind in this rapid disruption and transformation, and OPEN's mission is to push it forward into the modern age of internet and data powered commerce.” He also said, “At the moment, OPEN looks like one of the more promising opportunities in the sector, as its iBuying business model is battle tested and is clearly winning against competitors at the moment.”
Smith discussed the potential risks at play with OPEN as well, stating, “The biggest risks to keep in mind are the health of the housing market and general market sentiment on growth/tech stocks. However, as long as investors keep a long-term perspective and management continues to manage the balance sheet and inventory levels prudently as they have thus far, OPEN should be able to overcome these two primary risks and continue to leverage its competitive advantages to generate outsized long-term returns.” And ultimately, he concluded, “We view OPEN as a speculative Strong Buy at current prices.”
Nobias 4-star rated author, Davide Ravera, recently wrote an article which discussed the iBuying business model and OPEN’s plans to make its disruptive approach mainstream. Ravera said, “Simply put, iBuying is a technology that gives you the ability to buy and sell your real estate property directly online without the need for a realtor.”
Regarding the current market share of the iBuying industry, Ravera wrote, “Over the years, this technology developed, transforming the iBuying market into a relevant share of the U.S. Real Estate secondary market: today, the iBuying market represents about 1% of the US's home buying and selling market.” He continued, “Opendoor's goal is to bring iBuying from 1% of sales to the norm.”
Ravera noted that OPEN is currently operating in 44 markets across the United States; however, he said that the company’s stated goal is to eventually reach roughly 70% of U.S. consumers. Therefore, Ravera highlighted OPEN’s total addressable market (TAM), stating, “In the 10-K, the total addressable for real estate transactions in the U.S. is quantified as about 2.3 trillion in 2021. That means a market of about 1.6 trillion for Opendoor in the future. Indeed the goal of Opendoor is to reach 70% of the population in the United States. After that, it might try to expand further to cover a higher percentage of the United States or even other countries internationally. We expect the addressable market to increase at about 3.8% per year, in line with a real 1% home appreciation and a 10-year inflation expectation of 2.8%.”
Ravera says that Opendoor’s margins have steadily improved over the last year; however, he is quick to point out that this operational performance has come during one of the strongest bull markets in the housing space in years.
Investors aren’t certain that OPEN’s model will prove to be profitable over the long-term (which is why the stock is so volatile). Yet, Ravera believes that with increasing scale, OPEN’s business model will prove to be moderately successful over the long-term. He said, “Clearly, being a cyclical industry, you have to expect the gross margin to go down in a negative market for real estate. That's why I expect the business to become profitable in the next ten years but to remain with a low marginality in the long run.”
In his conclusion, Ravera highlighted the strong disruption potential for OPEN, noting the stock’s long growth runway due to the very large total addressable market that it could capture; but, the speculative risks at play for OPEN inspired him to place a “neutral” rating on shares.
Regarding those risks, Ravera stated, “For example, how could the company behave in a bear real estate market? Can the company scale without requiring ever-larger house listings and, therefore, more and more investments?” Ultimately, he concluded, “These are unanswered questions from our side, and for this reason, we remain neutral on OPEN for the time being.”
Nobias 4-star rated author, Tezcan Gecgil, highlighted OPEN’s Q1 data in an article published on March 30th, titled, “Opendoor’s iBuying Dominance Makes OPEN Stock a Bargain Under $10”. Gecgil wrote, “On Feb. 24, Opendoor issued Q4 results. Revenue surged to $3.82 billion, representing a whopping 1,435% increase YOY. Opendoor acquired 9,639 homes during the quarter.”
Gecgil continued, “On the other hand, the company sold more homes than it purchased, ending 2021 with $6.1 billion in inventory. Total homes sold in 2021 soared 119% to 21,725, helping to fuel revenue growth of over 200% to $8 billion.”
Regarding profits, Gecgil stated, “However, net loss widened to $191 million, or 31 cents per share, compared with $54 million in the prior-year quarter. The higher-than-expected loss was primarily due higher selling costs and higher stock-based compensation.”
Nicholas Ward is a Senior Investment Analyst at Wide Moat Research. He has spent the last 8 years writing about the stock market at various publications, including Seeking Alpha, The Street, Forbes Real Estate Investor, Sure Dividend, The Dividend Kings, iREIT, Safe High Yield, and The Intelligent Dividend Investor.
With the Q4 results in mind, Gecgil said, “Q4 financials seem to prove that the iBuying model can work. Opendoor has secured the lion’s share of the iBuying space following Zillow’s exit.” On March 30th, OPEN shares were trading in the $9.15/share area.
Gecgil concluded, “OPEN stock looks priced to reflect all possible adverse outcomes and not much of its potential. As a result, the current depressed valuation leaves plenty of room for significant upside and provides a buying opportunity for long-term investors.”
Today, OPEN trades for just $5.70/share, implying that the long-term value proposition has become even more attractive. Looking at the aggregate data that the Nobias algorithm has collected regarding credible reports and opinions published on OPEN shares, it’s clear that the majority of authors/analysts that we track are bullish on OPEN after its recent sell-off. 78% of recent articles published on the stock by credible authors have expressed a “Bullish” bias.
Right now, the average price target being applied to OPEN shares by the credible Wall Street analysts that Nobias tracks is $18.00/share. Relative to today’s $5.70 share price, this average price target implies upside potential of approximately 216%.
Disclosure: As of 6/12/2022, Nicholas Ward has no OPEN position. Nicholas Ward wrote this article for Nobias at their request with a view of giving investors a balanced perspective based on the writings of Nobias highly rated analysts and bloggers. Nobias has no business relationship with any company whose stock is mentioned in this article and does not have a position in this stock.
Additional disclosure: All content is published and provided as an information source for investors capable of making their own investment decisions. None of the information offered should be construed to be advice or a recommendation that any particular security, portfolio of securities, transaction, or investment strategy is suitable for any specific person. The information offered is impersonal and not tailored to the investment needs of any specific person.
Disclaimer: The Nobias star rating is based on past performance results and is not an indicator of future results. These past performance returns do not represent returns that any investor actually earned. Assumptions made include the ability to purchase the stocks recommended by the author under liquid markets where the transaction would be at the market price for the day. In reality, loss in liquidity may have a material impact on the returns that actually may have been earned. Further, returns are calculated without any including transaction costs, management fees, performance fees or expenses, or reinvestment of dividends and other income. This information is provided for illustrative purposes only.
PFE with Nobias Technology: Case Study on Pfizer
Fundamentally speaking, Pfizer (PFE) has been one of the biggest beneficiaries of the COVID-19 pandemic. This company’s earnings-per-share increased by 99% in 2021, rising from $2.22/share in 2020 to $4.42 last year. What’s more, analysts expect to see the company continue to grow its bottom-line nicely this year as well, with the current consensus EPS growth rate estimate for Pfizer’s 2022 EPS coming in at 46%. These gains are largely on the back of the company’s leading position in the COVID-19 vaccine race. And, while PFE has received a nice fiscal windfall because of its success in combating COVID-19, the question remains, how long will the COVID-19 cash flows last?
Fundamentally speaking, Pfizer (PFE) has been one of the biggest beneficiaries of the COVID-19 pandemic. This company’s earnings-per-share increased by 99% in 2021, rising from $2.22/share in 2020 to $4.42 last year. What’s more, analysts expect to see the company continue to grow its bottom-line nicely this year as well, with the current consensus EPS growth rate estimate for Pfizer’s 2022 EPS coming in at 46%. These gains are largely on the back of the company’s leading position in the COVID-19 vaccine race. And, while PFE has received a nice fiscal windfall because of its success in combating COVID-19, the question remains, how long will the COVID-19 cash flows last?
Because of this major question market that is associated with the stock, PFE shares are currently trading for very cheap valuations. Even with its ~100% 2021 EPS growth and another ~50% or so growth expected this year, PFE is trading for just 10.06x its blended earnings-per-share. On a forward basis, shares are even cheaper. PFE is trading for just 8.25x 2022 EPS estimates.
Looking at the consensus EPS for 2023 and 2024, the reason for PFE’s cheap valuation becomes clear. Right now, analysts are calling for -20% EPS growth in 2023 and another -19% growth on top of that in 2024. In other words, Wall Street doesn’t believe that PFE can maintain its fundamental success levels that were largely propped up by COVID-19 vaccine sales. Yet, even with these fears in mind, when looking at the opinions expressed by the credible authors and analysts that the Nobias algorithm tracks, the sentiment surrounding this stock is clearly bullish.

PFE Jun 2022
Hamna Asim, a Nobias 4-star rated author, recently highlighted Pfizer’s popularity amongst retail investors in an article titled, “10 High-Yield Dividend Stocks Popular on Robinhood”. Asim wrote, “High yield dividend stocks act as sanctuaries for investors amid a turbulent stock market, since share price gains in a portfolio are unlikely in a macro backdrop plagued with inflation, possible recession, war, and rising rates. Investors tend to gravitate towards high yield stocks to get passive income and secure their investments, since these companies usually have strong fundamentals and stay on top of their performance to be able to keep up their dividend policy and maintain the trust of their stakeholders.”
And, specifically regarding PFE shares, Asim said, “Pfizer Inc. (NYSE:PFE) is an American multinational biopharmaceutical company that manufactures and markets medicines and vaccines in multiple therapeutic areas. Pfizer Inc. (NYSE:PFE)’s dividend yield on May 20 came in at 3.10%, and it is one of the 100 most popular stocks traded on Robinhood.”
Regarding PFE’s dividend, Asim stated, “Pfizer Inc. (NYSE:PFE) declared a $0.40 per share quarterly dividend on April 28, in line with previous. The dividend is payable on June 10, to shareholders of record as of May 13. Pfizer Inc. (NYSE:PFE) has a 12-year history of consistently increasing dividend payments.” Pfizer shares currently yield 2.99%.
Interestingly enough, it’s not just the retail investors on Robinhood who’ve been investing in PFE shares. Asim also stated, “In addition to Exxon Mobil Corporation (NYSE:XOM), Altria Group, Inc. (NYSE:MO), and Intel Corporation (NASDAQ:INTC), institutional investors are piling into Pfizer Inc. (NYSE:PFE).” In a recent Bloomberg report published by Nobias 4-star author, Riley Griffin, touched upon a major part of the bullish PFE thesis moving forward.
Griffin highlighted recent data showing that the PFE COVID-19 vaccine was “highly effective” in children under 5 and therefore, this unvaccinated population provides the company with a longer COVID-19 vaccine sales runway.
Griffin wrote, “Pfizer Inc. and BioNTech SE said their Covid vaccine was highly effective and prompted a strong immune response in children under age 5, based on early results from a trial that is likely to pave the way for infants and toddlers to finally get immunized.” Griffin continued, “A three-dose regimen was 80.3% effective in a preliminary finding based on 10 infections in children ages 6 months through 4 years old, the vaccine partners said in a statement on Monday.”
Griffin’s article concluded, “The US Food and Drug Administration is expected to convene advisory committee meetings in June to discuss the risks and benefits of both the Pfizer-BioNTech and Moderna vaccines in the youngest children, and provide a recommendation as to whether or not they should be cleared for emergency use.”
Showing the potential size of this opportunity for PFE, in a recently published article, Nobias 5-star rated author, Lauran Neergaard, stated, “The 18 million youngsters under 5 are the only group in the U.S. not yet eligible for COVID-19 vaccination.”
Neergaard continued, “Pfizer has had a bumpy time figuring out its approach. It aims to give tots an extra low dose — just one-tenth of the amount adults receive — but discovered during its trial that two shots didn’t seem quite strong enough for preschoolers. So researchers gave a third shot to more than 1,600 youngsters — from age 6 months to 4 years — during the winter surge of the omicron variant.” And, she said, “In a press release, Pfizer and its partner BioNTech said the extra shot did the trick, revving up the children's levels of virus-fighting antibodies enough to meet FDA criteria for emergency use of the vaccine with no safety problems.”
More recently, news broke that the White House has aggressive plans to vaccinate children against the COVID-19 virus as fears of a resurgence of infections during the upcoming winter months grows.
Jonathan Block, a Nobias 4-star rated author, recently published an article at Seeking Alpha which stated, “The White House on Wednesday unveiled its plans to vaccinate millions of children under the age of 5 with the COVID-19 shot.” Block continued, “Last week, the Biden administration made 5 million doses available to states and health care providers to order. Another 5 million was made available to order this week.”
Block concluded, “The U.S. FDA has yet to authorize COVID vaccinations in the below 5 age group but is expected to do so soon. On June 2, White House Coronavirus Response Coordinator Ashish Jha said the shots could begin as soon as June 21.”
Furthermore, PFE’s successful development of an anti-viral drug that fights existing COVID-19 infections successfully is yet another potential bullish catalyst for this company. Nathan Reiff, a Nobias 4-star rated author, recently published an article which touched upon the ongoing investments that PFE is making into its anti-viral production facility because of the potential long-term growth runway that its drug, Paxlovid, could have. Reiff said, “Pharmaceutical giant Pfizer Inc. (PFE) announced on June 6 that it planned to significantly increase its investment in U.S. manufacturing in support of Paxlovid, its COVID-19 oral treatment. The company will make a $120 million investment in its Kalamazoo, Mich. manufacturing facility to increase production of pharmaceutical ingredients for the drug.1 The U.S. Food and Drug Administration (FDA) issued an emergency use authorization for Paxlovid in certain cases last December.”
Nicholas Ward is a Senior Investment Analyst at Wide Moat Research. He has spent the last 8 years writing about the stock market at various publications, including Seeking Alpha, The Street, Forbes Real Estate Investor, Sure Dividend, The Dividend Kings, iREIT, Safe High Yield, and The Intelligent Dividend Investor.
Reiff continued, “Pfizer aims to produce 120 million courses of Paxlovid in 2022.3 As of Pfizer's announcement, the company says it has shipped 12 million courses of the antiviral treatment to 37 countries, including five million to the U.S.” It is unclear, as of this point in time, what impact Paxlovid will have on PFE’s top and bottom-line moving forward, but this drug is yet another potential blockbuster that PFE has in its portfolio, assuming that the COVID-19 virus is here to stay.
PFE shares are down 2.71% during the last week; however, on a year-to-date basis, they have outperformed the market by a fairly wide margin. PFE shares are down 8.6% during 2022 thus far. The S&P 500 is down 16.24% during this same period. And, looking at the opinions expressed by the credible individuals that Nobias tracks, it appears as if this relative outperformance may continue.
90% of recent articles published by credible authors have included a “Bullish” bias. Right now, the average price target being applied to PFE shares by the credible Wall Street analysts that our algorithm tracks is $55.67. Today, PFE shares trade for $51.78/share. Therefore, this average price target implies upside potential of 7.5%. Overall, with PFE’s 2.99% dividend yield factored in, analysts are calling for double digit total return upside.
Disclosure: Nicholas Ward is long PFE. Nicholas Ward wrote this article for Nobias at their request with a view of giving investors a balanced perspective based on the writings of Nobias highly rated analysts and bloggers. Nobias has no business relationship with any company whose stock is mentioned in this article and does not have a position in this stock.
Additional disclosure: All content is published and provided as an information source for investors capable of making their own investment decisions. None of the information offered should be construed to be advice or a recommendation that any particular security, portfolio of securities, transaction, or investment strategy is suitable for any specific person. The information offered is impersonal and not tailored to the investment needs of any specific person.
Disclaimer: The Nobias star rating is based on past performance results and is not an indicator of future results. These past performance returns do not represent returns that any investor actually earned. Assumptions made include the ability to purchase the stocks recommended by the author under liquid markets where the transaction would be at the market price for the day. In reality, loss in liquidity may have a material impact on the returns that actually may have been earned. Further, returns are calculated without any including transaction costs, management fees, performance fees or expenses, or reinvestment of dividends and other income. This information is provided for illustrative purposes only.
CRM with Nobias Technology: Case Study on Salesforce
From Saleforce’s (CRM) IPO in mid-2004 to the end of 2021, shares rose from $11.00 to the stock’s current 52-week high of $311.75. For years, CRM was a juggernaut in the growth stock space, enriching shareholders with market beating results. However, CRM shares have experienced much more bearish sentiment throughout 2022 thus far.
From Saleforce’s (CRM) IPO in mid-2004 to the end of 2021, shares rose from $11.00 to the stock’s current 52-week high of $311.75. For years, CRM was a juggernaut in the growth stock space, enriching shareholders with market beating results. However, CRM shares have experienced much more bearish sentiment throughout 2022 thus far.
Highly valued growth stocks have plummeted this year as investors reduce risk in the face of uncertain macroeconomic conditions and rising interest rates. CRM shares have been caught up in the negative sentiment surrounding speculatively valued technology stocks, down by 27.62% on a year-to-date basis.
However, the stock reported earnings on 5/31/2022 and since then, shares have risen more than 15.5%. The company surprised analysts with its top and bottom-line results. And, while uncertainty still surrounds the markets, Salesforce continues to post strong growth results. During its most recent quarter, the company’s revenues rose by 24.3% on a y/y basis. This is an impressive feat for a large-cap stock like CRM (the stock’s current market capitalization is $159.27 billion.
Nobias 4-star rated author, Mike Robinson, covered CRM’s Q1 results in a recent article published at the Street Register. Robinson wrote, “Salesforce.com reported earnings per share at $0.98 for revenue $7.41B. Investing.com polled analysts and predicted EPS at $0.9444 for revenue $7.38B.” During its Q1 report, Salesforce highlighted its results, stating:
First Quarter Revenue of $7.41 Billion, up 24% Year-Over-Year, 26% in Constant Currency
Current Remaining Performance Obligation of $21.5 Billion, up 21% Year-Over-Year, 24% in Constant Currency
First Quarter Operating Cash Flow of $3.68 Billion, up 14% Year-Over-Year
Initiates Second Quarter FY23 Revenue Guidance of $7.69 Billion to $7.70 Billion, up ~21% Year-Over-Year
Updates Full Year FY23 Revenue Guidance to $31.7 Billion to $31.8 Billion, up ~20% Year-Over-Year

CRM CRM 2022
During the quarterly report, Salesforce’s Co-CEO, Marc Benioff, stated, “We had another great quarter, delivering $7.4 billion in revenue, up 24% year-over-year. There is no greater measure of our resilience and the momentum in our business than the $42 billion we have in remaining performance obligation, representing all future revenue under contract. While delivering incredible growth at scale, we’re committed to consistent margin expansion and cash flow growth as part of our long-term plan to drive both top and bottom line performance.”
With regard to its top-line results, the company stated, “Subscription and support revenues for the quarter were $6.86 billion, an increase of 24% year-over-year. Professional services and other revenues for the quarter were $0.56 billion, an increase of 30% year-over-year.”
The company also highlighted its cash position, stating, “Cash generated from operations for the first quarter was $3.68 billion, an increase of 14% year-over-year. Total cash, cash equivalents and marketable securities ended the first quarter at $13.50 billion.”
Salesforce updated its full-year fiscal 2023 guidance as well. The company is now calling for full-year sales of $31.7-$31.8 billion, which would represent year-over-year growth of approximately 20%. The company expects to see GAAP operating margin of 3.8% and non-GAAP operating margin of 20.4%. CRM expects to see “~21%-22%” operating cash flow growth. And, with all of this in mind, the company is calling for full-year non-GAAP earnings-per-share to total $4.74-$4.76 this fiscal year.
Will CRM’s Q1 results be the spark at ignites a rally back towards the company’s prior highs?
Only time will tell.
However, since CRM’s earnings release on May 31st, Nobias has seen a slew of credible analysts (only those with 4 and 5-star ratings) update their price targets and Buy/Sell/Hold opinions on shares, with the majority of these updates including bullish sentiment.
The website, theflyonthewall.com collates analyst reports. On 6/1/2022, the site highlighted an analyst report from Nobias 4-star rated Brad Zelnick, stating: “Deutsche Bank analyst Brad Zelnick lowered the firm's price target on Salesforce to $260 from $300 and keeps a Buy rating on the shares. The company last night reported better than expected fiscal Q1 results that exceeded on all relevant metrics, Zelnick tells investors in a research note. The analyst says "this was a solid beat and raise in a backdrop where others are missing and lowering."
Also, on 6/1/2022, in a report from Nobias 4-star rated analyst, Raimo Lenschow, stated: “Barclays analyst Raimo Lenschow raised the firm's price target on Salesforce to $218 from $208 and keeps an Overweight rating on the shares. The analyst believes Salesforce last night posted a "good enough" quarter when considering the lowered expectations from investors heading into the print. While there will be questions about the lowered fiscal 2023 sales guidance and some segments coming in below expectations, most of these issues could be traced back to currency and management "acting prudently here," says the analyst. He believes the business is "performing at a healthy pace and management commentary around end-demand appears to echo this."’
Nobias 4-star rated analyst, Michael Turrin, also published a post-earnings update on 6/1/2022. The Fly on the Wall covered the update, saying: “Wells Fargo analyst Michael Turrin raised the firm's price target on Salesforce to $235 from $225 and keeps an Overweight rating on the shares. The analyst notes Salesforce began 2023 with a consistent set of top-line metric. The Q2 guide calls for 15% growth in cRPO and 21% growth in total revenue, better than feared given investor concerns around the demand environment and scale/maturity of Salesforce, Turrin adds. While the top-line results remain largely consistent, the analyst believes the progress on margin is likely the greater focal point for investors, with management reiterating free cash flow guide of +24%-26% year-over-year, and raising the full year 2023 OM target by 40bps.”
Nobias 5-star rated analyst, Brent Bracelin, also raised his price target for Salesforce on 6/1/2022. The Fly on the Wall report stated: “Piper Sandler analyst Brent Bracelin lowered the firm's price target on Salesforce to $250 from $330 and keeps an Overweight rating on the shares. Last night's results "were solid given the audience of skeptics," Bracelin tells investors in a research note. The analyst is encouraged by the combination of a "better-than-feared" outlook, reaffirmation of the 20%-plus margin target even on lower revenue, and Salesforce's multi-cloud momentum.”
However, it is worth noting that not all credible analysts are equally as bullish. Nobias 4-star rated analyst, Yun Kim, from Loop Capital Ventures, noted that the firm was reducing its price target for Salesforce, from $225 to $175, in light of the company’s Q1 report. Kim maintains CRM as a “Hold”.
Nobias 4-star rated author, Vladimir Dimitrov recently published an article titled, “Salesforce Is Not Undervalued Yet” which also expresses a somewhat bearish sentiment for CRM shares. Dimitrov highlights CRM’s wonderful historical performance, but he doesn’t believe it was justified or sustainable. He wrote, “As Salesforce reached peak levels in the second halves of 2020 and 2021, many investors likely ascribed this superior performance to their unique ability to pick up the winners. Moreover, the optimistic picture about the future also resulted in expectations that CRM could continue to deliver similar returns well into the future.” “But,” he continued, “the reality was that this outstanding performance was not so caused by higher earnings, but rather by a massive increase in multiples.”
Dimitrov notes that CRM posted strong net income results in 2021; however, once again, he had qualms with those figures. The author stated, “The high net income figures in FY 2021 and 2022 were almost entirely driven by gains on strategic investments and one-time tax benefits.” He continues, saying, “Therefore, if CRM's outstanding returns were not driven by business fundamentals, what is left is that they were subject to exogenous factors.”
Nicholas Ward is a Senior Investment Analyst at Wide Moat Research. He has spent the last 8 years writing about the stock market at various publications, including Seeking Alpha, The Street, Forbes Real Estate Investor, Sure Dividend, The Dividend Kings, iREIT, Safe High Yield, and The Intelligent Dividend Investor.
Dimitrov stated, “Unfortunately, however, the real driver was fiscal and monetary intervention. The two periods of elevated P/S multiples we saw above also coincided with the periods when the Federal Reserve significantly expanded its balance sheet.” And, he concluded, “In a nutshell, Salesforce exceptionally strong performance up until the second half of 2021 was not caused by the company's outstanding business fundamentals, but rather by policy decisions made at the U.S. Federal Reserve.”
Being that the Fed is leaning hawkish right now with its economic policy stance, Dimitrov does not express a bullish outlook for CRM shares. He acknowledges the stock’s recent pullback, but writes, “following the recent decline CRM has become far less risky than it was when I first covered the company almost a year and a half ago. That is why I now change my rating from Bearish to Neutral.”
Overall, the bearish authors/analysts tracking CRM shares are in the minority, with regard to the individuals and firms followed by the Nobias algorithm. Right now, 86% of recent articles published on CRM shares have expressed “Bullish” sentiment. And, the average price target currently being applied to CRM by the credible Wall Street analysts that Nobias tracks is $234.19. This figure is well below the stock’s recent 52-week highs; however, relative to the company’s current share price of $184.91, it implies update potential of approximately 26.6%. Therefore, even after the stock’s recent 15%+ rally, according to the credible analyst that the Nobias algorithm tracks, CRM appears to have more room to run.
Disclosure: Nicholas Ward is long CRM. Nicholas Ward wrote this article for Nobias at their request with a view of giving investors a balanced perspective based on the writings of Nobias highly rated analysts and bloggers. Nobias has no business relationship with any company whose stock is mentioned in this article and does not have a position in this stock.
Additional disclosure: All content is published and provided as an information source for investors capable of making their own investment decisions. None of the information offered should be construed to be advice or a recommendation that any particular security, portfolio of securities, transaction, or investment strategy is suitable for any specific person. The information offered is impersonal and not tailored to the investment needs of any specific person.
Disclaimer: The Nobias star rating is based on past performance results and is not an indicator of future results. These past performance returns do not represent returns that any investor actually earned. Assumptions made include the ability to purchase the stocks recommended by the author under liquid markets where the transaction would be at the market price for the day. In reality, loss in liquidity may have a material impact on the returns that actually may have been earned. Further, returns are calculated without any including transaction costs, management fees, performance fees or expenses, or reinvestment of dividends and other income. This information is provided for illustrative purposes only.
GOOGL with Nobias Technology: Case Study on Google
Since its IPO back in 2004, Alphabet (GOOGL), which was then known as Google, has been synonymous with the high growth rates and strong alpha that has been generated by the big winners hailing from Silicon Valley. This stock has one of the world’s largest market capitalizations, at $1.48 trillion. The company has one of the world’s strongest balance sheets, with a AA+ Standard and Poor’s credit rating and nearly $134 billion of cash, cash equivalents, and marketable securities on the books as of the end of its most recent quarter. Alphabet shares have posted total returns of 128.67% and 684.08% during the last 5 and 10-year periods, respectively. Both of these figures are well above the total return results posted by the S&P 500 during the same period (during the last 5 years, the S&P 500 is up approximately 68.4% and during the last 10 years, the major index is up approximately 221%).
Since its IPO back in 2004, Alphabet (GOOGL), which was then known as Google, has been synonymous with the high growth rates and strong alpha that has been generated by the big winners hailing from Silicon Valley. This stock has one of the world’s largest market capitalizations, at $1.48 trillion. The company has one of the world’s strongest balance sheets, with a AA+ Standard and Poor’s credit rating and nearly $134 billion of cash, cash equivalents, and marketable securities on the books as of the end of its most recent quarter. Alphabet shares have posted total returns of 128.67% and 684.08% during the last 5 and 10-year periods, respectively. Both of these figures are well above the total return results posted by the S&P 500 during the same period (during the last 5 years, the S&P 500 is up approximately 68.4% and during the last 10 years, the major index is up approximately 221%).
What’s potentially most impressive about this relative alpha is that GOOGL shares are currently well off of their recent all-time highs. In late 2021, GOOGL shares were trading north of $3,000/share. Today, GOOGL shares trade for just $2,277.84 (representing a discount of 24.8% from its 52-week, and all-time highs, of $3030.93). Looking back at Alphabet’s history, such significant sell-offs like this have been rare. And, looking at the recent analysis performed by the credible authors and Wall Street analysts tracked by the Nobias algorithm, it appears that that the vast majority of credible individuals that we follow are “Bullish” and looking to take advantage of this dip.
Regarding the company’s recent dip, Sirisha Bhogaraju, a Nobias 4-star rated author, recently described some of the catalysts for the negative sentiment that has surrounded GOOGL shares throughout recent weeks in an article published at Nasdaq.com.

GOOGL May 2022
In the aftermath of GOOGL’s Q1 report, Bhogaraju wrote, “Investors were particularly concerned about the slowdown in YouTube advertising revenue in Q1, Suspension [sic] of the company's commercial activities in Russia, the pullback in ad spending in Europe amid the Russia-Ukraine conflict, the impact of inflation and other macro headwinds on companies’ ad spending, and tough comparisons hurt YouTube’s Q1 advertising revenue.”
However, Bhogaraju is bullish on the company’s long-term future, highlighting several areas of growth that the company continues to invest in. She stated, “Alphabet continues to invest in lucrative areas, like its cloud business, which generated $5.8 billion of revenue in Q1, reflecting 44% of growth. Though the cloud division is still losing money, the company is optimistic about its future prospects amid growing transition of enterprises to the cloud.”
Bhogaraju continued, “Alphabet is also investing in YouTube to enhance the platform by adding features like YouTube Shorts and live shopping. YouTube Shorts, Alphabet’s attempt to compete against rival TikTok, is now garnering over 30 billion daily views, which is almost four times more than last year’s numbers.” She said that Google continues to invest in artificial technologies which bolster the capabilities of its digital search platform.
And, Bhogaraju said that “Alphabet is also positive about its other small businesses like its hardware products (e.g. FitBit, Pixel devices, Google Nest home products) and the Other Bets division (comprises its health technology solutions and self-driving car unit Waymo). Though still very small, it’s worth noting that Q1 revenue from Other Bets more than doubled to $440 million.”
Regarding the “buy the dip” mentality that we’re seeing when it comes to the sentiment surrounding GOOGL shares, Bhogaraju agrees. She concluded, “Wall Street analysts see the weakness in YouTube ad spending as a temporary headwind, and continue to be optimistic about Alphabet’s long-term prospects based on the dominance of Google search engine and YouTube, the growing Cloud business, and other opportunities.”
David Trainer, a Nobias 4-star rated author, recently published a bullish report on Alphabet at Seeking Alpha, titled, “Google: Big Value In Big Tech”. Trainer highlighted the company’s strong bottom-line results, stating: “Alphabet’s advertising business enables the company to generate strong free cash flow. Over the past five years, Alphabet generated cumulative FCF of $134.9 billion (9% of market cap), second only to Apple (AAPL) among companies in the S&P 500.
Over the TTM, Alphabet’s FCF of $54.6 billion is 1.2x the combined FCF of Microsoft (MSFT) and Meta Platforms (FB) and 32x the average TTM FCF of all S&P 500 companies.” He continued, noting that these strong cash flows enable Alphabet to invest heavily into its business (enhancing its future growth potential).
Trainer wrote, “Alphabet leverages its cash-generating advertising business to fund substantial research and development (R&D) spending, which creates a significant competitive advantage for the company. Alphabet’s five-year cumulative R&D spend is the most of all companies in the S&P 500”. He continued, “Alphabet’s R&D spending over the past five years is 1.5x Microsoft’s, 1.5x Apple’s, and 2x pharmaceutical giant Johnson & Johnson’s (JNJ) R&D spending.”
Regarding growth, Trainer said, “Alphabet is more than just an advertising business and its cloud segment drives further revenue growth.” He continued, stating that “cloud revenue rose from $4.1 billion in 2017 to $19.2 billion in 2021, or 48% compounded annually. Over the TTM, Google Cloud revenue is $21 billion and accounts for 8% of total revenue.”
Trainer touched upon the negative sentiment surrounding “big-tech” stocks because of anti-trust reforms and potential regulation coming from regulators in the United State and abroad; however, he ultimately concluded, “Over the long run, Alphabet is likely to navigate regulatory challenges and deliver profits. Indeed, its business has proven to be more resilient to privacy-related changes than Meta’s. Large incumbent companies are often best equipped to navigate highly regulated industries. Alphabet is armed with the cash, political savvy, and services that deliver a social good which could help the company widen its moat as it positions its business to comply with regulatory complexities.”
Trainer also highlighted the fact that as Alphabet attempts to diversify its revenue stream and moves away from a pure-play digital advertising company, its margins will likely fall (due to the incredibly high margins that the company generates with its Google properties in the advertising markets). Yet, he said, “As the company grows other segments of its business, those segments are not likely to match the high margins Alphabet’s advertising segment achieves, which could lower the company’s overall ROIC. Nonetheless, as long as other segments generate an ROIC above its weighted average cost of capital, the company will create more shareholder value as it grows economic earnings through these additional segments.”
Even with these risks in mind, Trainer believes that the stock is too cheap. He stated, “Concerns over political and regulatory risks have helped drive the stock down 21% year-to-date. However, given the resiliency of Alphabet’s business model, this decline provides investors with an attractive entry point.”
Nicholas Ward is a Senior Investment Analyst at Wide Moat Research. He has spent the last 8 years writing about the stock market at various publications, including Seeking Alpha, The Street, Forbes Real Estate Investor, Sure Dividend, The Dividend Kings, iREIT, Safe High Yield, and The Intelligent Dividend Investor.
Trainer continued, “The stock’s price-to-economic book value (PEBV) ratio is 1.1 is at its cheapest level since 2012, when the stock traded at just $354/share. A PEBV ratio of 1.1 means the market expects Alphabet’s NOPAT [net operating profit after tax] to grow to no more than 10% above TTM levels, which seems overly pessimistic.”
Not every analyst is overly bullish on GOOGL these days, however. Shanthi Rexaline, a Nobias 4-star rated author recently published an article which highlighted the opinion of KeyBanc Capital Markets analyst, Justin Patterson, who is a Nobias 4-star rated analyst, regarding the negative implication that Snap Incs (SNAP) recent profit warnings could have across the technology sector.
Rexaline examined Patterson’s report, stating that the analyst believes that Alphabet is one of six companies likely to face similar issues as Snap moving forward, resulting in both lower revenues and profit margins. Rexaline wrote, “The analyst sees more incremental risks to Google's margins, as its revenue shifts to low-margin, high-investment areas such as Cloud.”
Overall, 85% of recent reports that we’ve seen published by credible authors have expressed a “Bullish” sentiment on GOOGL shares. Right now, the average price target being applied to GOOGL by the credible Wall Street analysts that the Nobias algorithm tracks is $3262.78. Relative to today’s share price of $2277.84, this average price target represents upside potential of approximately 30.2%.
Disclosure: Of the stocks mentioned in this article, Nicholas Ward has long positions in GOOGL, AAPL, MSFT, FB, and JNJ. Nicholas Ward wrote this article for Nobias at their request with a view of giving investors a balanced perspective based on the writings of Nobias highly rated analysts and bloggers. Nobias has no business relationship with any company whose stock is mentioned in this article and does not have a position in this stock.
Additional disclosure: All content is published and provided as an information source for investors capable of making their own investment decisions. None of the information offered should be construed to be advice or a recommendation that any particular security, portfolio of securities, transaction, or investment strategy is suitable for any specific person. The information offered is impersonal and not tailored to the investment needs of any specific person.
Disclaimer: The Nobias star rating is based on past performance results and is not an indicator of future results. These past performance returns do not represent returns that any investor actually earned. Assumptions made include the ability to purchase the stocks recommended by the author under liquid markets where the transaction would be at the market price for the day. In reality, loss in liquidity may have a material impact on the returns that actually may have been earned. Further, returns are calculated without any including transaction costs, management fees, performance fees or expenses, or reinvestment of dividends and other income. This information is provided for illustrative purposes only.
HD with Nobias Technology: Case Study on Home Depot
Nobias recently published a report on Wal-Mart’s (WMT) historic sell-off. WMT shares are down nearly 25.9% from their 52-week highs after falling more than 19.7% during the last week alone, representing the company’s worst weekly losses since the flash crash in 1987. This sell-off was largely inspired by the disappointing guidance that Wal-Mart provided during its recent Q1 report. WMT management made it clear to investors that inflation was hurting its margins and therefore, eating away at its profits.
Nobias recently published a report on Wal-Mart’s (WMT) historic sell-off. WMT shares are down nearly 25.9% from their 52-week highs after falling more than 19.7% during the last week alone, representing the company’s worst weekly losses since the flash crash in 1987. This sell-off was largely inspired by the disappointing guidance that Wal-Mart provided during its recent Q1 report. WMT management made it clear to investors that inflation was hurting its margins and therefore, eating away at its profits.
And, in recent weeks, Wal-Mart isn’t the only major retailer that has struggled. Shares of Target (TGT) were down 28.74% last week. Ross Stores (ROST) sold off 21.2% last week. Williams-Sonoma (WSM) saw its shares fall double digits, down 12.3% last week. And, the retail weakness even reached into the more defensive grocery space, with Kroger (KR) seeing its shares dip by 8.65% during the last 5 trading sessions.
Yet, looking across the retail landscape, there is a relative outperformer that has begun to shine, relative to its peers (and the broader market at large). Home Depot (HD) shares were only down 1.97% last week (during a period of time when the S&P 500 fell by 2.87%).
Like so many of its peers in the retail space, HD shares are down well off of their all-time highs. HD’s 52-week high is $420.61 and today, shares trade for $287.19. Yet, since reporting first quarter numbers a couple of weeks ago, it’s clear that this home improvement retailer is a bright spot in the retail landscape, providing investors with a potential safe haven in the storm that is currently being created by rampant inflation.

BRK.B May 2022
Dani Romero, a Nobias 5-star rated author, published an article on Yahoo Finance recently which focused on the negative impact that inflation is having on the retail sector as a whole. Romero wrote, “Inflation appears to be spilling into all parts of the economy, with one primary reason being ongoing supply chain constraints.”
She interviewed former Home Depot CEO Bob Nardelli, who said, “Inflation is inseparably linked to the supply chain. look at a global view of the container ships around the world and we have well over 550 ships right now floating on the water waiting to get unloaded. We have an equal number of tankers floating on the water ready to get unloaded."
Romero stated, “The pandemic created the perfect storm to disrupt supply chains: Port backups, container shortages, and other supply chain nightmares meant that retailers and brands were largely put at the mercy of forces outside their control.” And, Nardelli provided a bleak outlook, saying, "Supply chain has caught every company off guard here, and I just don't see it getting better.”
Romero said that China “holds the cards” with regard to its potential to improve the current situation, noting that, “A fifth of the world’s containerships are stuck in congested ports, according to Windward data, and a quarter of those "stuck ships" are at Chinese ports. Since February, the number of container vessels waiting outside of Chinese ports has risen by 195%.”
Because of these backups, she noted that research firm Resilinc recently said that it costs “roughly twice as much” to ship a container across the Pacific than it did one year ago. But, she continued, “Home Depot (HD) seems to be weathering these challenges surprisingly well.” Romero said, “Sales rose nearly 4% from a year ago to $38.9 billion and were the highest-ever for the first quarter in the company's history.”
Mike Robinson, a Nobias 4-star rated author, reported on Home Depot’s Q1 report recently at The Street Register. He touched upon the stock’s recent underperformance, stating, “Home Depot shares have fallen 28% since the start of the year. However, they are still below 29.63% of its 52-week high of $420.61 on December 6, 2021. They are under-performing the S&P 500 which is down 15.91% from the start of the year.”
Regarding the Q1 results, Robinson wrote, “Home Depot posted earnings per share (EPS) of $4.09 for revenue $38.91B. Investing.com polled analysts and predicted EPS at $3.68 for revenue $36.57B.” In a separate article that Robinson published focused on HD’s Q1 data, he said, “Analysts expected to see a drop of 2.2% in comparable sales, but the 2.2% increase was 31% YoY. The U.S. sales of comparable products rose 1.7% in the quarter, an increase of 29.9% YoY. This beats the predicted decline by 1.75%. The average ticket sale was $91.72, an increase of 11% over the previous year.”
Robinson quoted the company’s report which stated, “The solid performance in the quarter is even more impressive as we were comparing against last year’s historic growth and faced a slower start to spring this year.”
Robinson noted that HD provided forward guidance during its earnings update, writing, “HD anticipates EPS growth of the low single digits for the entire fiscal 2023. This is in contrast to the previous forecast that saw EPS growth in high-single digits. Similar sales will rise by roughly 3 percent, compared to 1.45% as previously anticipated.”
Michele Chapman, a Nobias 5-star rated author, also highlighted HD’s results, touching upon the home improvement retailer's performance in a tough housing market, writing, “Home Depot has continued to lure customers despite what may be a cooling of the housing market. Sales of previously occupied U.S. homes slowed in March to the slowest pace in nearly two years as a swift rise in mortgage rates and record-high prices discouraged would-be homebuyers.” She wrote, “Existing home sales fell 2.7% last month from February to a seasonally adjusted annual rate of 5.77 million, the National Association of Realtors said.”
Regarding the housing market, she continued, “Last week mortgage buyer Freddie Mac reported that the 30-year rate ticked up to 5.3% from 5.27% a week earlier. By contrast, the average rate stood at 2.94% a year ago.”
Regarding the relative performance that HD posted during the quarter, Chapman wrote, “The quarterly sales exhibited the slowest pace of growth in two years, noted Neil Saunders, managing director of GlobalData, adding that it was still a pretty good quarter and that the company has managed to keep all the gains it made during the pandemic.”
Chapman continued to quote Saunders, who said, “We do not see an enormous collapse in demand as many households are still willing to invest in and improve their homes; but there is a definite softening on the cards which we have not seen for quite some time.”
Nicholas Ward is a Senior Investment Analyst at Wide Moat Research. He has spent the last 8 years writing about the stock market at various publications, including Seeking Alpha, The Street, Forbes Real Estate Investor, Sure Dividend, The Dividend Kings, iREIT, Safe High Yield, and The Intelligent Dividend Investor.
Although rising mortgage rates have slowed down home buying in recent weeks, Mary Meisenzahl, a Nobias 4-star rated author, recently put a spotlight on HD management’s commentary, which suggests that the current housing market isn’t all bad for the retailer’s outlook. She wrote, “In the future, however, some experts are predicting a slowdown coming for the housing market, which could have an impact on Home Depot's bread and butter business of home improvement.”
However, Meisenzahl quoted HD’s CFO Richard McPhail, who provided bullish commentary on the company’s earnings call. She wrote, “According to McPhail, Home Depot's homeowner customers are more likely to invest in improving their homes as values increase, and prices have increased at the fastest rate in over 40 years.”
Overall, the vast majority of credible authors that Nobias tracks continue to express “Bullish” bias when it comes to Home Depot shares, with 93% of recent articles providing a positive outlook. Looking at reports published by the credible Wall Street analysts that the Nobias algorithm tracks, the average price target currently being applied to HD shares is $346.10. Today, HD trades for $287.19; therefore, this $346.10 fair value target implies upside potential of approximately 15.2%.
Disclosure: Of the stocks discussed in this article, Nicholas Ward is long HD. Nicholas Ward wrote this article for Nobias at their request with a view of giving investors a balanced perspective based on the writings of Nobias highly rated analysts and bloggers. Nobias has no business relationship with any company whose stock is mentioned in this article and does not have a position in this stock.
Additional disclosure: All content is published and provided as an information source for investors capable of making their own investment decisions. None of the information offered should be construed to be advice or a recommendation that any particular security, portfolio of securities, transaction, or investment strategy is suitable for any specific person. The information offered is impersonal and not tailored to the investment needs of any specific person.
Disclaimer: The Nobias star rating is based on past performance results and is not an indicator of future results. These past performance returns do not represent returns that any investor actually earned. Assumptions made include the ability to purchase the stocks recommended by the author under liquid markets where the transaction would be at the market price for the day. In reality, loss in liquidity may have a material impact on the returns that actually may have been earned. Further, returns are calculated without any including transaction costs, management fees, performance fees or expenses, or reinvestment of dividends and other income. This information is provided for illustrative purposes only.
BRK with Nobias Technology: Case Study on Berkshire Hathaway
Berkshire Hathaway (BRK.A)(BRK.B) hit an all-time high in late March. At the time, Berkshire shares were outperforming the broader market by a wide margin. Through March 31st, the S&P 500 was down approximately 5.5% on the year. Berkshire, on the other hand, was up roughly 17.3%.
Berkshire Hathaway (BRK.A)(BRK.B) hit an all-time high in late March. At the time, Berkshire shares were outperforming the broader market by a wide margin. Through March 31st, the S&P 500 was down approximately 5.5% on the year. Berkshire, on the other hand, was up roughly 17.3%.
BRK.B posted first quarter earnings on April 30th and since then, the stock has trended downward. During the last month, Berkshire shares are down 10.18%. This has pushed the stock’s year-to-date performance down to 3.18%. These 3%+ gains still represent significant alpha relative to the S&P 500’s year-to-date losses of 16.11%; however, down 14.2% from all-time highs, several credible authors tracked by the Nobias algorithm have published bullish reports, highlighting their belief that BRK.A/BRK.B is a potential bargain here in the $300 area.
Shortly before Berkshire’s recent earnings report, Growth at a Good Price, a Nobias 5-star rated author, wrote an article titled, “Berkshire Hathaway: All-Time High And Still A Buy”. Even though BRK shares have slipped since this article was published, the 5-star rated author clearly laid out their thesis for why BRK was likely to continue to outperform during today’s volatile market environment.
The author said, “ In the last 12 months, Berkshire has grown its earnings to record levels, bought back shares, and added a brand new insurer to its portfolio. It’s been a great run, and the market has rewarded Berkshire with record highs.” They continued, “Many stocks are down this year, as are the S&P 500 and NASDAQ-100. Is it reasonable to expect Berkshire to keep outperforming when so many of its mega-cap peers are undergoing difficulties? I would argue that, yes, it is reasonable to expect that.”
Regarding the company’s defensive stance, Growth at a Good Price stated: “It is well known that Berkshire Hathaway invests in companies that have economic moats. These include:
Companies in industries with high barriers to entry (banks, utilities).
Companies whose customers face high switching costs.
Companies with strong brand identities like Apple (AAPL).”
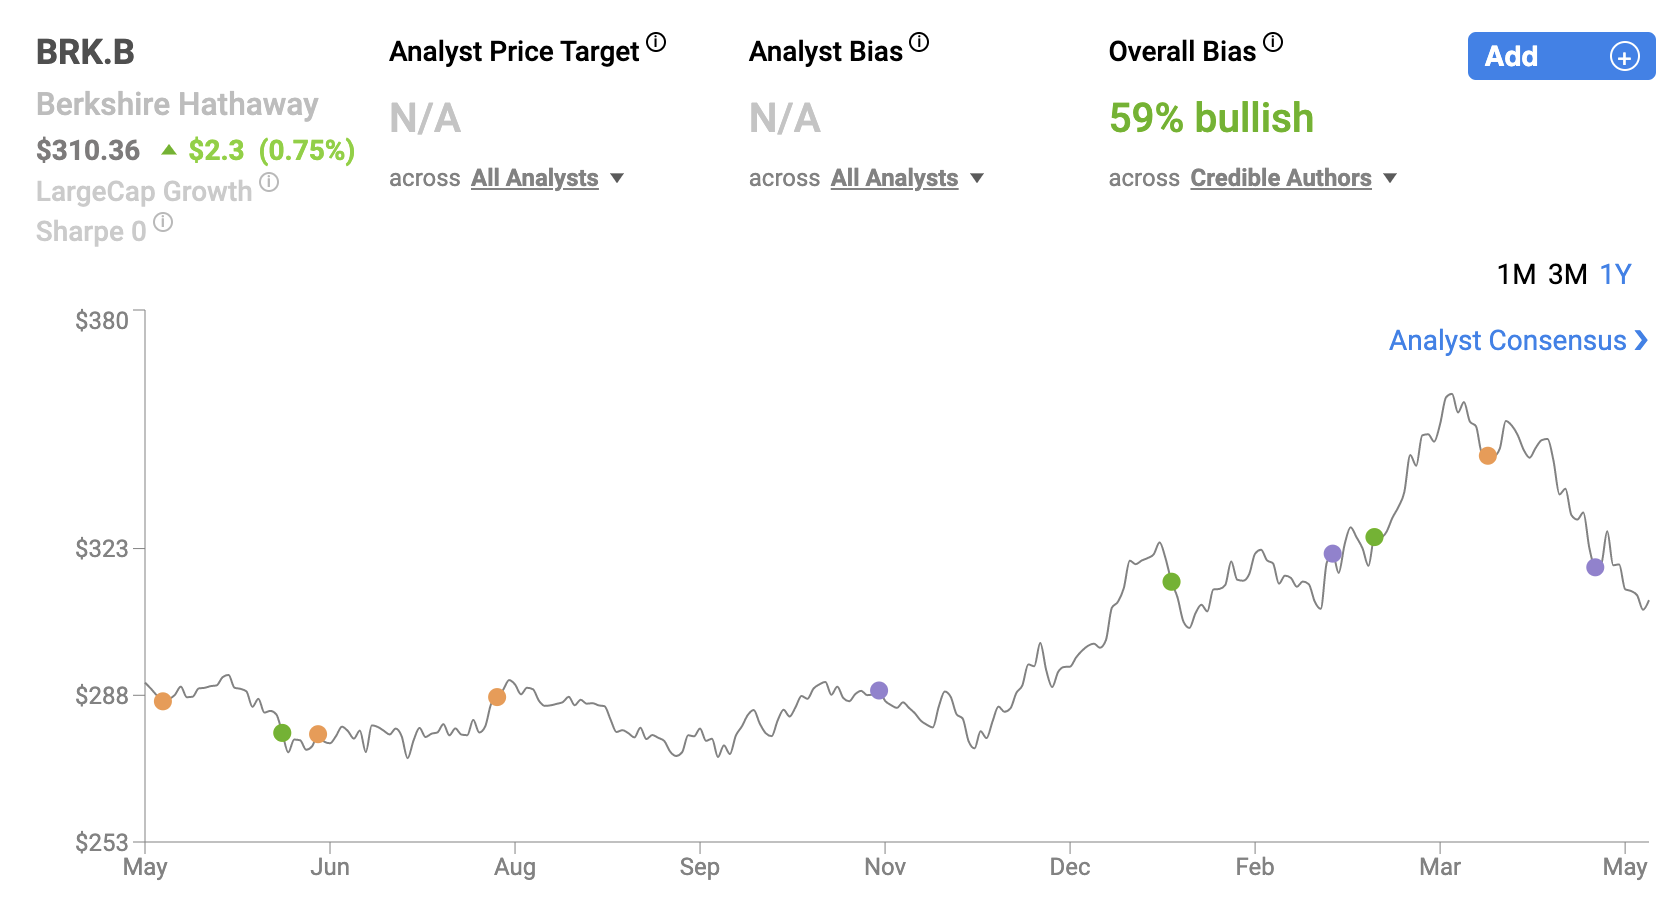
BRK.B May 2022
They stated, “The Berkshire Hathaway Energy companies are mostly utilities, which are protected by high barriers to entry.” And, regarding the advantages of defensive moats, the author said, “Moats increase the likelihood of solid earnings results because, among other things, they give companies pricing power–the ability to raise prices without reducing demand. When a company faces little competition, it can raise prices easily, because its customers have no alternative suppliers.”
Coming into the Q1 report, the author said, “Berkshire Hathaway’s financials are, as you’d probably expect, fantastic.” They pointed out: “For the full fiscal year, Berkshire reported:
Revenue: $276.09 billion in revenue, up 12.46%.
Operating income: $114.8 billion, up 64.75%.
Net income: $89.79 billion, up 111%.
Free cash flow: $61.69 billion, up 47.9%.
Common equity: $514.9 billion.”
Even near all-time highs, the author touched upon Berkshire’s relatively cheap valuation. They said, “When you look at Berkshire’s overall package of growth, profitability, and balance sheet strength, you’d think that the stock would trade at a premium. After all, it’s without a doubt a high-quality asset. But when we look at some of Berkshire’s key valuation multiples, we can see that it isn’t overpriced at all.”
Then, Growth at a Good Price stated: “At today’s prices, BRK.B trades at just:
8.9 times GAAP earnings.
2.89 times sales.
1.54 times book value.
19 times operating cash flow.”
Since then, BRK’s share price has dropped by nearly 15%. During Q1, Berkshire’s operational earnings were relatively flat, coming in at $7.04B vs. $7.29B in Q4 2021 and $7.02B in Q1 2021. But, even without outsized growth, it appears that Growth at a Good Price’s thesis remains intact. They concluded their article stating, “Near all-time highs, it’s still cheap relative to its overwhelmingly solid fundamentals. And in today’s market, quality counts.”
One thing that analysts continue to point out, when it comes to a bullish Berkshire thesis, is that Warren Buffett himself, who is one of the world’s richest individuals and widely considered to be one of the greatest all-time investors, has been using a share repurchase program to buy back Berkshire shares.
Daniel Foelber, a Nobias 4-star rated author, recently published an article at The Motley Fool, which highlighted Buffett’s illustrious career. Foelber said, “Buffett is one of the greatest investors of all time. The compound annual growth rate of Berkshire Hathaway between 1965 and 2021 is a staggering 20.1% -- which is one of the best long-term track records out there.” He points out that Buffett has achieved this success by making “bold” bets on high conviction ideas.
Foelber wrote, “Today, Berkshire Hathaway owns $358.7 billion in public securities. Of that amount, 66% is concentrated in Apple, Bank of America, and American Express. Seventy-six percent is in the top five holdings. And 87% is in the top 10 holdings.”
Regarding this portfolio concentration, Foelber said, “On the surface, having 45% of a portfolio in Apple stock may look extremely risky.” “But,” he continued, “Buffett is known for his shrewd research, high conviction, and preference to go with only his best ideas.” With this in mind, seeing Buffett consistently buy back Berkshire shares is often seen as a bullish signal for BRK.A/BRK.B stock.
Buybacks only happen when Buffett, his partner, Charlie Munger, and the other leaders at Berkshire believe that their shares are cheap. And, when Warren Buffett - the consummate value investor - believes that Berkshire shares are cheap, the market tends to hop on board that trend.
During Q4 2021, Berkshire bought back $6.9 billion worth of Berkshire shares. And, during the more recently announced Q1 2022 report, the company highlighted $3.2 billion worth of buybacks.
The Q1 buyback number was lower on a sequential basis; however, as Timothy Bowens, a Nobias 4-star rated author recently pointed out, the company used its war chest of cash during Q1 to take advantage of the market’s macro dip.
Bowens wrote, “The company had $143.9 billion in cash and US Treasury bills as of December 31. on March 31, 2021, and reduced to $102.7 billion by March 31, 2022.” He continued, “While the conglomerate was looking to start the year slowly in terms of investment activity, in three weeks from February 21 it spent more than $40 billion”.
In a separate recent article, Bowens touched upon these recent investments in more detail, highlighting Berkshire’s focus on the energy sector. He wrote, “According to Berkshire’s latest 13F filing, the company purchased 118.3 million shares of OXY in multiple transactions from March 12 to 16, bringing its stake in OXY to 136.4 million shares, or ~14.6% of its outstanding shares. Berkshire also owns warrants from OXY that provide the right to purchase an additional 83.9 million shares of common stock at about $59.62 each, plus an additional 100,000 shares of OXY preferred stock.” He also said, “Earlier, Berkshire revealed that it bought around 9.4 million shares of oil titan Chevron in the fourth quarter, increasing its stake to 38 million shares currently worth $6.2 billion.”
The Energy sector is the #1 performing area of the market during 2022 thus far, up 44.83% on a year-to-date basis. The Energy sector is the only sector with positive year-to-date performance in today’s market environment; the second highest performing S&P 500 sector on a YTD basis is Consumer Staples, which have posted losses of 0.32% during 2022.
Historically, Bowens writes, Buffett has been more likely to go against the grain as opposed to chasing the market’s momentum. However, that trend has changed recently. Bowens wrote, “For decades, Berkshire Hathaway Chairman and CEO Warren Buffett maintained a fairly conservative approach to investing, favoring retail and banking stocks, while giving ample leeway to more volatile sectors such as technology and energy.”
He continued, “Lately, though, Buffett seems to be veering away from his famous ethos of buying stocks with a decent margin of safety. After all, he has been doubling down on his energy investments while cutting his holdings in technology and banking even though oil and gas stocks have had high valuations for several years while technology stocks are decidedly cheaper.”
However, Bowens likes this move. He highlighted the global supply constraints being put on the global energy markets, largely related to the sanctions that many countries are putting on Russian oil exports, as well as the secular nature of the ongoing ESG (environmental, social, and governmental) movement, and said that he believes this will create a positive environment for energy names for the foreseeable future.
Bowens wrote, “And, make no mistake about it: Oil markets are likely to remain undersupplied for years to come, whether the Ukraine crisis is quickly resolved or not, thanks in large part to years of underinvestment amid the ESG boom.”
Bowens concluded his piece saying, “Given this backdrop, it’s no surprise that Warren Buffett abandoned his well-known investment mantra of being afraid when others are greedy and greedy when they’re afraid and heeding Sir Winston Churchill’s warning to never let a good crisis go to waste.”
He also pointed out: “One final note: Oil stocks remain undervalued, and the S&P energy sector is still far behind its 2014 levels since the last time oil broke above $100 a barrel.”
Carl Surran, a Nobias 4-star rated author, recently published a report at Seeking Alpha which highlighted a recent major renewable energy project that Berkshire has embarked upon too, showing the diverse nature of the firm’s energy and utility assets.
Surran said, “Warren Buffett's Berkshire Hathaway (BRK.A, BRK.B) unveils plans for a $3.9B renewable energy project in Iowa, including wind and solar generation, in a project that could rank as one of the biggest in the renewable industry.” He continued, “In a filing with the Iowa Utilities Board, Berkshire's MidAmerican Energy says its proposed Wind PRIME prject [sic] would add more than 2K MW of wind generation and 50 MW of solar generation to Iowa, bolstering the state's already significant wind market.”
The energy space isn’t the only area of Berkshire’s business that has performed well lately. Joanna Marsh, a Nobias 4-star rated author, recently penned an article at Freightwaves.com, which highlighted the profit gains of Berkshire’s railway assets.
Nicholas Ward is a Senior Investment Analyst at Wide Moat Research. He has spent the last 8 years writing about the stock market at various publications, including Seeking Alpha, The Street, Forbes Real Estate Investor, Sure Dividend, The Dividend Kings, iREIT, Safe High Yield, and The Intelligent Dividend Investor.
Marsh wrote, “BNSF’s first-quarter 2022 net profit rose 10% despite a 3% decline in volumes, the company reported Monday.” She continued, “First-quarter 2022 net income was $1.37 billion, compared with $1.25 billion in the first quarter of 2021. BNSF is a privately held company whose parent is Berkshire Hathaway (NYSE: BRK.B).”
Regarding sales, Marsh wrote, “Total revenues grew 10% to nearly $5.97 billion amid a 14% gain in average revenue per unit, which in turn was supported by higher fuel surcharge revenue.” She highlighted the segment performance of Berkshire’s BNSF Railway, saying that its Consumer Product revenues rose 10% to $2.08 billion, its Agricultural Products revenues rose by 4% to $1.36 billion, its Industrial revenues rose to $13 billion, and its Coal volumes rose by 30% to $889 million.
Finally, she said, “Operating income rose 8% to $2 billion, while operating ratio (OR) was 64.6%, compared with 63.7% a year ago. Investors sometimes use OR to gauge the financial health of a company, with a lower OR implying improved health.”
Overall, 59% of recent articles published by credible authors focused on Berkshire Hathaway have included a “Bullish” bias, showing that the majority of individuals that we track agrees with Growth at a Good Price’s thesis: even after year-to-date outperformance, Berkshire shares remain attractive.
Disclosure: Nicholas Ward has no BRK.A or BRK.B position. Nicholas Ward wrote this article for Nobias at their request with a view of giving investors a balanced perspective based on the writings of Nobias highly rated analysts and bloggers. Nobias has no business relationship with any company whose stock is mentioned in this article and does not have a position in this stock.
Additional disclosure: All content is published and provided as an information source for investors capable of making their own investment decisions. None of the information offered should be construed to be advice or a recommendation that any particular security, portfolio of securities, transaction, or investment strategy is suitable for any specific person. The information offered is impersonal and not tailored to the investment needs of any specific person.
Disclaimer: The Nobias star rating is based on past performance results and is not an indicator of future results. These past performance returns do not represent returns that any investor actually earned. Assumptions made include the ability to purchase the stocks recommended by the author under liquid markets where the transaction would be at the market price for the day. In reality, loss in liquidity may have a material impact on the returns that actually may have been earned. Further, returns are calculated without any including transaction costs, management fees, performance fees or expenses, or reinvestment of dividends and other income. This information is provided for illustrative purposes only.