
FB, TWTR and SNAP with Nobias Technology: Case Study on two Social Media companies
Last week, we provided an update on Meta Platorm’s (FB) recent sell-off, its Q1 results, the ensuing rally, and the bias that we’re seeing amongst the credible authors and analysts that the Nobias algorithm tracks. In the report, we stated, “86% of the recent reports that we’ve seen published by credible authors came with a “Bullish” bias attached.”
Last week, we provided an update on Meta Platorm’s (FB) recent sell-off, its Q1 results, the ensuing rally, and the bias that we’re seeing amongst the credible authors and analysts that the Nobias algorithm tracks. In the report, we stated, “86% of the recent reports that we’ve seen published by credible authors came with a “Bullish” bias attached.”
We also noted that: “In response to these earnings, FB shares rallied 17.59% on Thursday. The stock ended the trading session at $205.73. And yet, even with this 17.59% rally in mind, that $205.73 closing price is still significantly lower than the average price target being applied to shares by the credible Wall Street analysts that the Nobias algorithm tracks. That average price target currently sits at $318.40, which implies upside potential of 54.77% from the stock’s current share price.”
The current rally has continued. Today, FB shares trade for $223.41. And, the changing sentiment surrounding this stock has inspired us to take a look at a couple of Meta’s largest competitors, Snap Inc. (SNAP) and Twitter (TWTR) to see what the credible authors and analysts that we track think about these two companies as well.
Nobias covered Twitter recently as well, highlighting the then rumor, and eventual news, regarding Elon Musk’s attempt to take the company private. In those reports, we highlighted the relatively negative sentiment surrounding TWTR shares. While the vast majority of credible authors have expressed bullish opinions on FB recently, the same cannot be said of TWTR. Right now, 87% of recent articles that we’ve tracked recently have expressed “Bullish” bias towards FB stock. TWTR, on the other hand, has seen 60% of recent reports express a bearish bias.
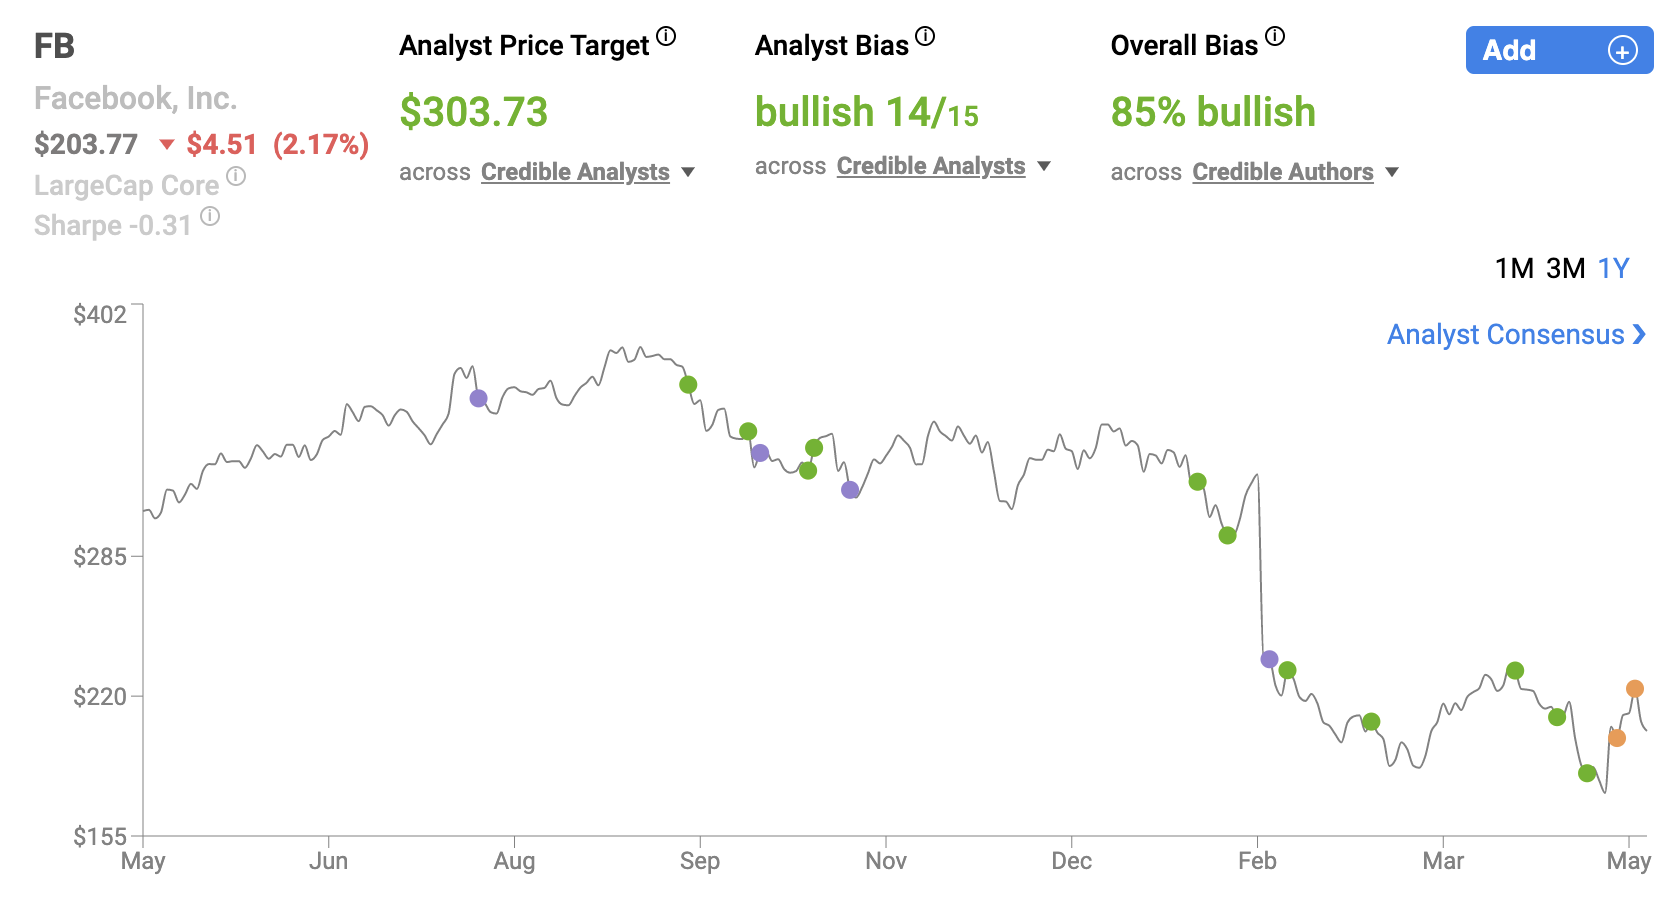
FB May 2022
Furthermore, the current consensus price target for Meta shares amongst the credible analysts that we track is $298.88. This implies upside potential of approximately 33.8% relative to the stock’s current price. Right now, the average price target being applied to TWTR shares is $49.90, well below Musk’s proposed takeover price of $54.20, and essentially in-line with the stock’s current share price of $49.06 (the average price target being applied to TWTR represents upside potential of just 1.7%).
In a recent article published by Nobias 4-star rated author, Vlad Savov, some of the potential roadblocks to Musk’s grand plans for Twitter were brought to light. Savov touches upon Musk’s vision to use Twitter to facilitate free speech; however, he believes that the company may struggle in its biggest growth markets.
Savov wrote, “Asia, home to more than half the world’s population, is Twitter’s biggest growth opportunity and arguably a far thornier challenge. If the Tesla Inc. and SpaceX billionaire makes good on promises to scrap censorship, he’ll encounter a plethora of perplexing regulations, wielded by sometimes authoritarian governments, pushed to the limits by a horde of first-time internet users.”
Regarding the Chinese market specifically, Savov wrote, “Twitter is officially banned in China, but the country will still demand a lot of Musk’s attention. Amazon.com Inc. founder Jeff Bezos alluded to the potential conflicts in a tweet shortly after Musk’s deal, asking “Did the Chinese government just gain a bit of leverage over the town square?” He continued, “The company in 2020 instituted labels for government officials and “state-affiliated media” for publications like Xinhua and Global Times, and readers are reminded of this government-backing any time they like or retweet stories.”
Savov said, “Chinese media have called the practice “intimidation” and already begun to lobby the billionaire to roll it back.” With regard to Musk’s take on free speech, Savov mentioned a Tweet that the billionaire published which stated, “By ‘free speech’, I simply mean that which matches the law. I am against censorship that goes far beyond the law.”
Regarding this Chinese saga, Savov concluded, “Could Beijing also offer up access to its 1.4 billion people? Perhaps under the right terms. They would certainly not include free speech.” Savov brings up similar concerns related to the Indian and other southeast Asian markets, implying that conflicts of interest and regulation could pose problems for the company moving forward.
Brett Molina, a Nobias 4-star rated author, expressed a more bullish outlook on Twitter in a recent report that he published at Yahoo Finance, touching upon initiatives that Musk might take to increase the value and profitability of the Twitter platform.
Molia wrote, “Musk said he could cut executive and board pay to cut costs and find opportunities to monetize tweets, according to a Reuters report.” He continued, “Other changes to the service might include easing content moderation, which Musk has criticized, cutting back on ads, and introducing an edit button.”
Molina said, “One of the big benefits for taking Twitter private is Musk can make changes more quickly without worrying about pleasing shareholders.” And, he quoted Wedbush Securities analyst Dan Ives, who recently said, “We think a subscription service will be key to a potential turnaround for Twitter. We view this as one of the first business model changes to the platform."
Since our last update, Twitter posted its Q1 earnings results. The company missed on the top-line, reporting revenue of $1.2 billion (which was $30 million below consensus estimates). But, this $1.2 billion sales figure did represent 15.4% year-over-year growth. TWTR’s non-GAAP EPS came in at $0.90/share, beating estimates by $0.87/share. During the quarter, Twitter’s advertising revenue increased by 23%, totaling $1.11 billion.
The company noted that, “Costs and expenses totaled $1.33 billion, an increase of 35% year-over-year. This resulted in an operating loss of $128 million and -11% operating margin, compared to an operating income of $52 million or 5% operating margin in the same period of the previous year.”
Furthermore, Twitter said, “Stock-based compensation (SBC) expense grew 60% year-over-year to $177 million and was approximately 15% of total revenue.” However, while costs were on the rise, so were users. Twitter stated, “Average monetizable daily active usage (mDAU)[2] was 229.0 million for Q1, up 15.9% compared to Q1 of the prior year.” The company noted that average U.S. mDAU’s were up 6.4% and average international mDAU’s were up 18.1%.
TWTR shares are relatively flat since posting these results. They’re down 0.39% during the last week. Therefore, it appears that the merger arbitrage game is limiting potential upside here. However, another social media platform also recently posted Q1 results and according to the credible authors and analysts that Nobias tracks, it has relatively attractive upside.
Albert Lin, a Nobias 4-star rated author, recently published an article at Seeking Alpha breaking down Snap’s earnings, which he called a “Mixed Bag”. Lin touched upon the results, saying, “Snap reported 1Q22 total revenue of $1.06 billion (+37.8% Y/Y) and non-GAAP EPS of -$0.02 which both came short of Street expectations of $1.07 billion and $0.01. Adj. EBITDA for the quarter was $64 million (vs. $22 million Street and guidance of breakeven), representing an adj. EBITDA margin of 6%.”
SNAP’s revenue totaled $1.06 billion during the quarter, up 38% y/y. Lin continued, “For 2Q22, the social media company guided revenue growth of 20-25% YoY (vs. +27% YoY Street) and adj. EBITDA of $0-50mm, short of Street estimates of $144 million.” SNAP said, “Daily Active Users increased 18% year-over-year to 332 million”. Lin touched upon this, saying, “this compares less favorably to the company's multi-quarter record of 20%+ growth.” Like TWTR, the majority of SNAP’s growth is coming from international markets.
Lin wrote, “Digging deeper into the user base, we can see growth stalling in North America where DAUs increased just 5% YoY in Q1 and 1% QoQ over the last 3 quarters.” He continued, “DAU growth in Rest of World appears to be picking up the slack in North America and Europe by contributing 10 million incremental users in Q1.”
But, Lin points out that this relative growth scenario isn’t ideal. He wrote, “However, RoW ARPU remains significantly below North America at just $0.95 vs. $7.77 in the quarter. In my view, the structurally lower revenue per user outside of Snap's core North American market poses a challenge to incremental revenue acceleration as the US market eventually slows.”
Ultimately, regarding SNAP (and the entire social media industry as a whole), Lin concluded, “Considering the company is yet to turn a profit, I believe investors are unlikely to stick with the stock through thick and thin under a hawkish Fed. That said, I would generally stay on the sidelines and recommend investors to do the same for all social media stocks including Twitter (TWTR), Pinterest (PINS) and Meta (FB).”
Irfan Ahmad, a Nobias 5-star rated author, recently published a much more bullish perspective, highlighting SNAP’s strong user growth and its leadership in the augmented reality market, saying that its Q1 results were “promising to say the least.”
Ahmad noted the higher ARPU that SNAP generates in international markets, but stated, “Keeping that point aside, Snap is still flourishing as the more users it has, the more the ads are viewed. Furthermore, this attracts more members to join in with promising aspects.” He continued, “Speaking of usage trends, Snap is doing quite well on that front, especially in regards to AR tools. Today, nearly 250 million users engage via AR elements on a routine basis. Similarly, more than 250,000 creators have used the Lens Studio to design 2.5 million Lenses, keeping creativity at an all-time high.”

Nicholas Ward is a Senior Investment Analyst at Wide Moat Research. He has spent the last 8 years writing about the stock market at various publications, including Seeking Alpha, The Street, Forbes Real Estate Investor, Sure Dividend, The Dividend Kings, iREIT, Safe High Yield, and The Intelligent Dividend Investor.
Ahmad continued, “This growing interest in AR Tools is another indication of how Snap could further benefit by venturing into the realm of creativity while keeping in mind the latest trends.” He stated, “It’s no surprise that both tech giants Apple and Meta are far ahead of the race because they’ve got more resources on hand. But despite this, Snap proves that it’s far better than them when it comes to staying on top of trends.”
And, he concluded, “Remember, most AR trends of today have stemmed all thanks to Snapchat and if it continues to work its magic with more AR tools, it could very well remain a leader in the market.” Overall, the consensus amongst the credible authors that Nobias tracks leans bullish when it comes to Snap Inc. 75% of recent articles published by such authors have expressed a “Bullish” bias.
The average price target currently being applied to SNAP shares by the credible Wall Street analysts that we track also implies bullish sentiment. SNAP’s current share price is $30.16. The average analyst price target that we track is currently $50.32. This implies upside potential of approximately 66.8%. Therefore, according to the credible analysts that we track, when comparing Meta, Twitter, and Snap, there is a clear winner: SNAP, with upside of nearly 67%.
Disclosure: Of the stocks discussed in this article, Nicholas Ward is long FB. Nicholas Ward wrote this article for Nobias at their request with a view of giving investors a balanced perspective based on the writings of Nobias highly rated analysts and bloggers. Nobias has no business relationship with any company whose stock is mentioned in this article and does not have a position in this stock.
Additional disclosure: All content is published and provided as an information source for investors capable of making their own investment decisions. None of the information offered should be construed to be advice or a recommendation that any particular security, portfolio of securities, transaction, or investment strategy is suitable for any specific person. The information offered is impersonal and not tailored to the investment needs of any specific person.
Disclaimer: The Nobias star rating is based on past performance results and is not an indicator of future results. These past performance returns do not represent returns that any investor actually earned. Assumptions made include the ability to purchase the stocks recommended by the author under liquid markets where the transaction would be at the market price for the day. In reality, loss in liquidity may have a material impact on the returns that actually may have been earned. Further, returns are calculated without any including transaction costs, management fees, performance fees or expenses, or reinvestment of dividends and other income. This information is provided for illustrative purposes only.
TSLA With Nobias Technology: Case Study on Tesla
Throughout 2022, Tesla (TSLA) shares have posted rare underperformance. However, last week the company posted first quarter earnings results which beat analyst consensus estimates on both the top and bottom lines. Shares rallied on the heels of those results while the Nasdaq sold off and we saw several credible authors/analyst post updated opinions on the company’s shares.
Throughout 2022, Tesla (TSLA) shares have posted rare underperformance. However, last week the company posted first quarter earnings results which beat analyst consensus estimates on both the top and bottom lines. Shares rallied on the heels of those results while the Nasdaq sold off and we saw several credible authors/analyst post updated opinions on the company’s shares.
Nobias 5-star rated author, Brandon Michael, recently published an article at Nasdaq.com which highlighted Tesla’s operations.
He wrote, “Being the poster child of the electric vehicle (EV) industry, Tesla would be no stranger to most investors. Put simply, Tesla designs, develops, sells, and leases electric vehicles and energy generation and storage systems. To create an entire sustainable energy ecosystem, it manufactures a unique set of energy solutions, Powerwall, Powerpack, and Solar Roof to enable consumers to transition to a green energy future.”
He continued, “As the automotive industry evolves to become greener, electric vehicles (EVs) have been leading the charge. Therefore, as the EV transition continues to accelerate, EV stocks could be worth a look in the stock market.”
In a recent article titled, “Tesla Is Up By 8%, Here Is Why”, Nobias 4-star rated author, Vladimir Zernov, broke down the company’s recent Q1 results saying, “Shares of Tesla gained strong upside momentum after the company released its first-quarter report. The company reported revenue of $18.76 billion and adjusted earnings of $3.22 per share, easily beating analyst estimates on both earnings and revenue.”
Zernov highlighted Tesla’s margins, which were a big part of the bullish Q1 storyline, saying, “The company noted that its operating margin was 19.2%, which was a material improvement from the operating margin of 14.7% in the fourth quarter of 2021. The comparison on a year-over-year basis is even more favorable, as operating margin was just 5.7% in the first quarter of 2021.”
Looking ahead, Zervov said, “Analysts expect that Tesla will report earnings of $10.56 per share in the current year and earnings of $13.72 per share in the next year, so the stock is trading at 76 forward P/E. However, earnings estimates keep moving higher, so traders are not worried about the rich valuation of the company.” He concluded, “The major improvement in the operating margin may serve as a longer-term positive catalyst for Tesla stock as it shows that the company’s profits could grow at a fast pace.”

TSLA April 2022
Samed Olukoya, a Nobias 4-star rated author, also recently covered Tesla’s Q1 earnings result in a recent article. Regarding the company’s $18.76 billion sales figure, Olukoya wrote, “The amount represents an 81 percent year-on-year increase when compared to $10.4 billion reported in the same period of 2021.” He continued, “According to the manufacturer, $16.86 billion of the total revenue, was generated from its automotive unit, an increase of 87% from the first quarter of 2021.”
Olukoya touched upon the company’s bottom-line results as well, writing, “Tesla also announced a $3.3 billion profit for the quarter under review.” Along these lines, he continued, “The company’s automotive gross margins jumped a record 32.9% while gross profit was $5.54 billion in its main segment.”
Olukoya mentioned that emissions credits helped to bolster the company’s results writing, “On emission credit sales to other automakers, the company filed $679 million, up from $314 million reported in Q4, 2021. Emission credit sales are credit sales to other automakers who make less clean vehicles than is required in the European Union area and the United Sales.” He also touched upon the bullish production outlook that Tesla’s CEO, Elon Musk laid out during the quarterly report.
Olukoya quoted Musk who said, “It seems likely that we’ll be able to produce one and a half million cars this year.”
In his piece, Michael touched upon this production target writing, “Financials aside, Tesla also remains confident in growing its vehicle delivery figures by 50% over 2021 numbers.”
Even with this strong Q1 beat in mind, TSLA shares are down 16.23% on a year-to-date basis. However, this short period of underperformance is a relative blip on the long-term radar for this company. TSLA shares are up 1531% during the last 5 years. They’re up nearly 15,400 during the last decade.
In short, Tesla has been one of the best performing equities in the entire market since its IPO, prompting Nobias 4-star rated author, Howard Smith, to recently pen an article titled, “Is It Too Late To Buy Tesla Shares?”
Howard wrote, “Valuation has always been the knock on Tesla from those who shunned the stock. After today's jump, Tesla is being valued with a market cap of $1.1 trillion. With a net income of about $5.5 billion in 2021, that gives it a trailing price-to-earnings (P/E) ratio of 200.”
Nicholas Ward is a Senior Investment Analyst at Wide Moat Research. He has spent the last 8 years writing about the stock market at various publications, including Seeking Alpha, The Street, Forbes Real Estate Investor, Sure Dividend, The Dividend Kings, iREIT, Safe High Yield, and The Intelligent Dividend Investor.
However, Howard continued, “But revenue in the first quarter of 2022 soared 81% year over year. And net income in the quarter was $3.3 billion. That elevated P/E will drop quickly if it continues to have results like it just produced. The company itself says it expects vehicle deliveries to be able to grow at a 50% rate annually for several years to come.”
Looking at the Q1 results, Howard said, “Based on the most recent quarter, that might be a conservative prediction.” Ultimately, he concluded, “Investors who buy it would need to have patience and expect volatility, however. That might mean it's not for everyone, but today's stock jump isn't a reason on its own to avoid the stock.”
Overall, the majority credible authors that the Nobias algorithm follows agrees with the bearish sentiment. 65% of recent reports that we’ve seen published by such authors have expressed a “Bearish” bias while credible analysts are bullish.
Looking at the credible Wall Street analysts that we track (only those with 4 or 5-star ratings) the average price target currently is $962. Relative to TSLA’s current share price of $870, this represents limited upside potential.
Therefore, it appears that much of the recent growth has already been priced into TSLA price estimates, though it is certainly possible that we see TSLA’s average price target rise as analysts factor in the recently reported Q1 figures into their evaluation models.
Disclosure: As of the writing of this article, Nicholas Ward has no TSLA position; however, because of TSLA’s Q1 beat, he may initiate a long position in the near future. Nicholas Ward wrote this article for Nobias at their request with a view of giving investors a balanced perspective based on the writings of Nobias highly rated analysts and bloggers. Nobias has no business relationship with any company whose stock is mentioned in this article and does not have a position in this stock.
Additional disclosure: All content is published and provided as an information source for investors capable of making their own investment decisions. None of the information offered should be construed to be advice or a recommendation that any particular security, portfolio of securities, transaction, or investment strategy is suitable for any specific person. The information offered is impersonal and not tailored to the investment needs of any specific person.
Disclaimer: The Nobias star rating is based on past performance results and is not an indicator of future results. These past performance returns do not represent returns that any investor actually earned. Assumptions made include the ability to purchase the stocks recommended by the author under liquid markets where the transaction would be at the market price for the day. In reality, loss in liquidity may have a material impact on the returns that actually may have been earned. Further, returns are calculated without any including transaction costs, management fees, performance fees or expenses, or reinvestment of dividends and other income. This information is provided for illustrative purposes only.
TWTR With Nobias Technology: Case Study on Twitter
With the world’s richest man, Elon Musk, making a significant investment in Twitter (TWTR) shares and then offering to take the company private with a buyout offer, TWTR shares have been on a volatile ride in recent weeks. Prior to Musk’s offer, Twitter was trading for less than $40/share. Then, they rallied up to approximately $53, before trending lower to their current share price of $48.93.
With the world’s richest man, Elon Musk, making a significant investment in Twitter (TWTR) shares and then offering to take the company private with a buyout offer, TWTR shares have been on a volatile ride in recent weeks. Prior to Musk’s offer, Twitter was trading for less than $40/share. Then, they rallied up to approximately $53, before trending lower to their current share price of $48.93.
Leo Sun covered the recent Must/Twitter saga in a recent article published at The Motley Fool. Sun said, “Twitter's stock recently went on a roller-coaster ride after Elon Musk -- who previously took a 9.2% stake in the social media company -- offered to buy all of its remaining shares for $54.20 apiece in a $43 billion deal. It's unclear if Musk is actually serious about buying Twitter, but its stock had delivered unimpressive growth for years before his abrupt bid.”
But, even with TWTR’s recent rally, Sun points out that the stock’s long-term performance has been underwhelming. He wrote, “Twitter went public on Nov. 7, 2013, at $26 per share and opened with a 74% gain at $45.10. But as of this writing, it still only trades in the high $40s.” Sun continued, “Investors who bought some IPO shares could have turned a $1,000 investment into about $1,800 today, but the same amount invested in an S&P 500 index fund during the same period would be worth roughly $2,500 now.”

TWTR April 2022
Sun then highlighted Twitter’s historical monthly active users (MAU) growth trends, ultimately, pointing out that this social media company is much smaller than its peers. He put a spotlight on Twitter’s early success with regard to MAU growth, pointing to the strong double digit that the company generated shortly after its IPO. He said, in 2013, Twitter’s MAU growth was 30. In 2014, that figure was 20%. And, in 2015, Twitter posted year-over-year MAU growth of 11%.
With growth slowing, Sun mentioned that “Founder and early CEO Jack Dorsey returned to succeed Costolo, but Twitter still struggled to gain new users. Its MAUs dipped to 319 million in 2016, rose to 330 million in 2017, but fell to 321 million in 2018.”
Sun continued, saying, “In 2019, Twitter stopped disclosing its MAUs altogether and rolled out a new metric: monetizable daily active users (mDAUs). It claimed that mDAUs filtered out the spam, bot, and inactive accounts which made it difficult for advertisers and investors to gauge its true engagement rates.” “But,” he contiued, “that change also revealed just how tiny Twitter was. Twitter ended 2019 with 152 million mDAUs. That figure rose 27% to 192 million in 2020 and grew another 13% to 217 million in 2021, but it's still a lot smaller than Snapchat, which ended last year with 319 million DAUs.”
Sun note that in early 2021, Twitter provided medium-term guidance, calling for 315 million mDAU by the end of 2023. He said, “It also declared it could more than double its annual revenue from $3.7 billion in 2020 to over $7.5 billion in 2023.”
This was great news for bulls; however, Dorsey recently left his position as Twitter CEO to focus on running Block (SQ), another company that he founded, which, as Sun says, “cast doubts” on the company’s ability to hit these 2023 targets.
Regarding Musk’s recent investing in TWTR, Sun said, “Musk, a vocal critic of Twitter's censorship policies, was initially appointed to its board of directors upon disclosing his initial stake in early April. But he subsequently turned down the offer, publicly mocked the company in a series of now-deleted tweets, and launched a full buyout offer.”
However, Sun says that he doesn’t expect Twitter’s board to accept Musk’s “best and final”offer and he concluded, “Therefore, I predict that Musk will eventually walk away, sell his stake, and Twitter will go right back to where it was before the buyout drama started.”
In other words, Sun believes Twitter’s share price is likely headed back to the $40 area and therefore, investors buying the stock today are putting themselves at risk of significant losses (Twitter currently trades for approximately $48/share).
It appears that Sun isn’t the only credible author that the Nobias algorithm tracks who has this opinion. The Asian Investor also recently published an article at Seeking Alpha offering a bearish opinion on TWTR shares after their recent rally.
They author wrote, “In response to recent developments surrounding Elon Musk and social media company Twitter (NYSE:TWTR), I am changing my recommendation from Twitter from buy to sell. Considering that a full hostile takeover of Twitter is unlikely, I believe it is best for shareholders to sell into the current strength!”
Regarding the likelihood that Twitter will accept Musk’s $54.20/share offer to buy 100% of Twitter, The Asian Investor said, “Board members have a fiduciary duty to evaluate take-over offers and make a determination about whether or not an offer is in the best financial interests of shareholders. I don't believe, at this point, that Twitter will accept Elon Musk's takeover offer and the company might look for another potential acquirer.”
The Asian Investor also believes that it’s possible that Twitter shares will fall back down to the ~$40 area in the near-term, meaning that they offer double digit downside potential in the near-term. They wrote: “In my last work on Twitter, I recommended to buy the social media company due to a strengthening ad business, strong user growth and improving free cash flow in FY 2022. I still believe these reasons are valid reasons to consider Twitter... if there wasn't a takeover offer on the table.
The surge in Twitter's stock price from $39, before the disclosure of Elon Musk's 9.2% stake, to $54 this week gives investors the opportunity to capture a huge takeover premium. If the takeover bid for Twitter gets rejected by the firm's board and Elon Musk officially abandons his hostile takeover of the company, the share price of Twitter is likely to sink back to where it was in March.”
However, we have seen bullish articles posted by credible authors recently as well. Julian Lin published a report on Seeking Alpha recently which highlighted his opinion that TWTR shares offer strong upside potential.
Lin stated, “From a valuation perspective, TWTR trades at only 6x sales. It trades at 55x earnings which does not look cheap, but this is the kind of company where operating leverage can cause the bottom line to grow at a rapid pace once the company decides to slow down investments in growth.” He continued, “Prior to Musk’s involvement, this stock has been a “show me” story, unable to achieve rich multiples in spite of what feels like an inevitable inflection point in monetization. Yet after Musk’s large buy-in, I could see the stock trading up to a 2x price to earnings growth ratio (‘PEG ratio’). TWTR has always seemed to trade based on the promise of future innovation - the presence of Musk makes such a possibility seem ever more likely, and that should be reflected in the valuation.”
Ultimately, Lin said, “Based on the 20% projected revenue growth rate, TWTR might trade at 12x sales, representing 100% upside over the next 12 months.” Regarding near-term risks, Lin says, “There still remains the risk that Musk eventually liquidates his position without any real impact, but the company has a solid balance sheet and is generating cash.” Finally, he states, “I nonetheless am optimistic that Musk can inspire some innovative changes in the company and the stock offers substantial upside in either case.”
Looking at the aggregate opinions of the credible authors and Wall Street analysts that the Nobias algorithm tracks, it’s clear that Twitter remains a battleground stock after the Musk news. Right now, 55% of recent reports published on the stock by credible authors have included a “Bearish” bias. And, looking at the $44.20 average price target being applied to TWTR shares by credible Wall Street analysts, we see that TWTR offers downside potential of approximately 9.6%.
We have seen analysts come out with price targets in the $50 area in recent weeks as the Musk news sinks in, but at this point in time, there is no clear consensus on the direction that credible authors/analysts expect the stock to trend.
UPDATE:
On 4/25/2022 news broke that - contrary to the opinions of the credible authors we originally cited - Twitter’s Board of Directors agreed to be acquired.
A press release published by the PRNewswire stated, “Twitter, Inc. (NYSE: TWTR) today announced that it has entered into a definitive agreement to be acquired by an entity wholly owned by Elon Musk, for $54.20 per share in cash in a transaction valued at approximately $44 billion. Upon completion of the transaction, Twitter will become a privately held company.”
The press release continued, “Under the terms of the agreement, Twitter stockholders will receive $54.20 in cash for each share of Twitter common stock that they own upon closing of the proposed transaction. The purchase price represents a 38% premium to Twitter's closing stock price on April 1, 2022, which was the last trading day before Mr. Musk disclosed his approximately 9% stake in Twitter.”
Nicholas Ward is a Senior Investment Analyst at Wide Moat Research. He has spent the last 8 years writing about the stock market at various publications, including Seeking Alpha, The Street, Forbes Real Estate Investor, Sure Dividend, The Dividend Kings, iREIT, Safe High Yield, and The Intelligent Dividend Investor.
Elon Musk was quoted saying: "Free speech is the bedrock of a functioning democracy, and Twitter is the digital town square where matters vital to the future of humanity are debated. I also want to make Twitter better than ever by enhancing the product with new features, making the algorithms open source to increase trust, defeating the spam bots, and authenticating all humans. Twitter has tremendous potential – I look forward to working with the company and the community of users to unlock it."
Although TWTR’s Board unanimously approved the takeover, the deal is also subject to shareholder approval. However, the press release stated that the deal is expected to close in 2022 now that Musk has funding lined up.
To finance this $44 billion deal, the release stated, “Mr. Musk has secured $25.5 billion of fully committed debt and margin loan financing and is providing an approximately $21.0 billion equity commitment. There are no financing conditions to the closing of the transaction.”
News that Musk used his personal Tesla (TSLA) stake as a part of a margin loan to secure funding caused Telsa shares to fall by 12.18% on 4/26/2022. Twitter closed the trading day on 4/26/2022 at $49.68. The proposed buyout price of $54.20 represents upside of approximately 9.1%.
As of 4/27/2022, the average price target being applied to TSLA shares by the credible Wall Street analysts that the Nobias algorithm tracks is $1010.00. After yesterday’s 12% sell-off, TSLA shares closed the trading day at $876.42. Relative to this closing price, the average price target discussed above represented upside potential of approximately 15.2%.
Disclosure: Of the stocks mentioned in this article, Nicholas Ward is long SQ. Nicholas Ward wrote this article for Nobias at their request with a view of giving investors a balanced perspective based on the writings of Nobias highly rated analysts and bloggers. Nobias has no business relationship with any company whose stock is mentioned in this article and does not have a position in this stock.
Additional disclosure: All content is published and provided as an information source for investors capable of making their own investment decisions. None of the information offered should be construed to be advice or a recommendation that any particular security, portfolio of securities, transaction, or investment strategy is suitable for any specific person. The information offered is impersonal and not tailored to the investment needs of any specific person.
Disclaimer: The Nobias star rating is based on past performance results and is not an indicator of future results. These past performance returns do not represent returns that any investor actually earned. Assumptions made include the ability to purchase the stocks recommended by the author under liquid markets where the transaction would be at the market price for the day. In reality, loss in liquidity may have a material impact on the returns that actually may have been earned. Further, returns are calculated without any including transaction costs, management fees, performance fees or expenses, or reinvestment of dividends and other income. This information is provided for illustrative purposes only.
JPM With Nobias Technology: Case Study on J.P.Morgan
J.P. Morgan (JPM) shares are down 18.91% on a year-to-date basis. During the last 30 days, JPM shares are down 6.16%. Although JPM has been surrounded by negative sentiment (from traders) throughout 2022, the credible authors and analysts tracked by the Nobias algorithm maintain a bullish bias on shares. The company reported Q1 earnings last week.
J.P. Morgan (JPM) shares are down 18.91% on a year-to-date basis. During the last 30 days, JPM shares are down 6.16%. Although JPM has been surrounded by negative sentiment (from traders) throughout 2022, the credible authors and analysts tracked by the Nobias algorithm maintain a bullish bias on shares. The company reported Q1 earnings last week. Richard Saintvilus, a Nobias 4-star rated author, published an earnings preview piece at Nasdaq.com.
Saintvilus wrote, “Offering a nice mix of earnings growth, income and value, JPMorgan Chase (JPM) has enjoyed a well-deserved reputation as being the best-executing bank among its peer group. However, its business is intricately tied to the U.S. and to some extent, the global, economy, given its status as the country’s largest bank.”
Regarding the bank’s near-term prospects, he noted, “inflationary pressures on consumers presents a potential headwind, though consumer balance sheets are currently strong and bookended by wage increases.” He also said, “the Federal Reserve has begun to raise interest rates, which bodes well for JPMorgan’s top and bottom forecasts and its net interest margins.”

JPM April 2022
Saintvilus touched upon some of the rationale spurring the negative sentiment that has recently surrounded JPM shares saying, “During its Q4 conference call, JPMorgan management spooked investors by forecasting operation expenditures that were significantly higher than analysts expected. The management team has a solid reputation for capital deployment, and thus I believe the spending should be viewed more as “investments” that are intended to help the bank maintain its leadership position and its ability to outperform its peer group.”
However, he wrote, “High double-digit returns from banks is not out of the question as the Fed being [sic] to raise rates and unwind asset purchases. Combined with its 2.50% dividend yield, which has grown at an average of almost 8% over the last five years, JPMorgan looks like a solid opportunity ahead of earnings.”
Speaking about JPM’s Q1 earnings potential, he said, “For the three months that ended March, analysts expect the New York-based bank to earn $2.69 per share on revenue of $31.08 billion. This compares to the year-ago quarter when earnings came to $4.50 per share on revenue of $30.52 billion.”
BOOX Research, a Nobias 4-star rated author, also touched upon Wall Street’s estimates for Q1 in a recent article, but also highlighted another piece of data: J.P. Morgan’s historical outperformance. BOOX Research wrote, “One of the curiosities about JPM is that the company has a strong record of beating the earnings estimates. Over the past 5 years, quarterly EPS has come in above the consensus in 17 of the last 20 quarters. On the revenue side, the history has been more variable but the point here is to say that it's a good bet that JPM can beat what we view as a low bar of expectations, or at least that the headline results won't have too many surprises.”
Ultimately, however, BOOX maintained a neutral stance on the stock, concluding, “We rate JPM as a hold with a price target for the year ahead at $150.00 per share representing a 13.5x multiple on the current 2022 consensus EPS. While our price target is about 12% higher than the current share price, it's not enough upside in our view to take an aggressively bullish position.”
When JPM reported Q1 results on April 13th, 2022, the company missed Wall Street’s expectations on the bottom-line, but the company managed to beat them on the top-line. JPM reported Q1 revenue of $30.7 billion, beating the consensus estimate by $170 million. This $30.7 billion sales result represented -5.0% year-over-year growth. JPM reported non-GAAP earnings-per-share of $2.63, which missed Wall Street’s expectation by $0.07.
Librarian Capital, a Nobias 4-star rated author, covered the JPM results in a recent article published at Seeking Alpha. They wrote, “JPM's Q1 2022 EPS was 41.4% lower year-on-year and 21.0% lower sequentially, but the underlying trends were actually positive”. They continued, breaking down JPM’s primary metrics. Librarian Capital said that the following metrics were “Normalizing” during Q1.
“Non-Interest Revenues were down 12.4% year-on-year (though up 5.9% from Q4 2021), including double-digit declines in Investment Banking Fees, Principal Transactions, Investment Securities Gains, Mortgage Fees & Related Income and Card Income. The first four can be attributed to an exceptional prior year, while Card Income fell due to higher new account acquisition costs as JPM invests to grow its Card business:”
”Net Interest Revenues grew 7.5% year-on-year and 1.9% from Q4 2021, with improvements in both loan balances and Net Yields (more below).”
“Non-Interest Expense grew 2.5% year-on-year, with structural growth and investments in the cost base offset by lower revenue-related costs.”“Pre-Provision Pre-Tax Profit, which excludes one-off reserve builds/releases, was 13.9% lower than the prior year, but slightly higher than both the preceding quarter than the (mostly) pre-COVID Q1 2020”.
“Provision for Credit Losses was positive $1.46bn, compared to negative figures of $4.16bn in Q1 2021 and $1.29bn in Q4 2021. This consisted of $0.6bn of Net Charge-Offs, no worse than prior quarters, and a reserve build of $0.9bn, compared to large releases before”
“The number of shares was down 3.3% year-on-year but flat sequentially, due to Q1 being the quarter when share incentives are recorded. JPM spent $2.5bn to repurchase 18.1m shares in Q1, but this was offset by 11.0m shares issued for employee compensation.”
“Return on Tangible Common Equity was 16%, lower than prior periods but in line with our (long-term average) assumption.”
“The Common Equity Tier-1 ("CET1") ratio was 11.9%, down from 13.0% in Q4, but near the top of management’s 11-12% target range. It was kept high in the preceding quarter to absorb anticipated charges.”
The author continued, saying that the follow metrics were “Stable, Excluding COVID Boost”:
“Consumer & Community Banking revenues were down 2.3% year-on-year, as higher revenues in Consumer & Business Banking (from higher deposits and client assets) were offset by lower revenues in Home Lending (mortgage activity was high last year due to low rates) and in Card & Auto (higher Card account acquisition costs, lower Auto volumes due to vehicle shortages).”
“Corporate & Investment Banking revenues were down 7.4% year-on-year, primarily due to much lower Investment Banking ("IB") fees for both Debt (down 20%) and Equity (down 76%) underwriting. IB Advisory fees were up, and Markets revenues were only 3% lower year-on-year. There was also a $524m loss in Credit Adjustments & Other, due to spreads widening and credit valuation adjustments (including on Russia-related exposure).”
“Commercial Banking revenues were up 0.2% year-on-year, with lower IB revenues being offset by higher payments revenue and deposits.”
“Asset & Wealth Management revenues were up 5.8% year-on-year, due to growth in deposits and loans, higher management and performance fees, and the absence of valuation gains in the prior year.”
Ultimately, the author concluded, “We upgrade our rating on JPMorgan Chase & Co. stock to Buy.” Librarian Capital laid our their bullish thesis saying: “Q1 results support the 16% Return on Tangible Common Equity we assume. With shares trading at 1.8x Tangible Book Value, this implies a 11.3x P/E. With shares at $126.12, we expect an exit price of $198 and a total return of 73% (16.8% annualized) by 2025 year-end.”
Nicholas Ward is a Senior Investment Analyst at Wide Moat Research. He has spent the last 8 years writing about the stock market at various publications, including Seeking Alpha, The Street, Forbes Real Estate Investor, Sure Dividend, The Dividend Kings, iREIT, Safe High Yield, and The Intelligent Dividend Investor.
Bram Berkowitz, a Nobias 4-star rated author, also recently published a bullish article on J.P. Morgan highlighting a specific area of the company that he expects to outperform. Berkowitz touched upon a series of headwinds impacting major financial institutions like JPM, but ultimately arrived at an attractive catalyst for shares, saying, “A lot of conflicting factors, such as rising interest rates, the normalization of credit, inflation, and Russia's ongoing invasion of Ukraine, could continue to make earnings unpredictable this year. However, one division at JPMorgan Chase that looks like it may perform better than initially expected this year is the corporate and investment bank (CIB).” He continued, “JPMorgan's CIB generated roughly $13.5 billion of revenue in the first quarter of this year, down about $1.1 billion from the remarkable first quarter of 2021 but up nearly $2 billion from the previous quarter.”
Berkowitz points out that there are headwinds for JPM’s CIB operations, writing, “One area of CIB that struggled a lot, however, is investment banking, which includes M&A Advisory and equity and debt underwriting. The struggles are not a surprise, as the volatile markets and war in Ukraine have brought M&A and initial public offerings (IPOs) to a screeching halt.” It’s unclear as to when M&A activity is going to pick back up (largely due to macro uncertainty and shaky management confidence sentiment); however, Berkowitz said, “Ultimately, equity and fixed-income trading is looking better than anticipated, while investment banking is struggling but perhaps will pick up later this year if conditions improve. On a net-net basis, I expect CIB revenue to come in better than initially thought this year.”
Overall, the vast majority of credible authors that we track with the Nobias algorithm share this bullish outlook while analysts are neutral. 92% of recent articles published by credible authors have included a “Bullish” bias. Of the credible Wall Street analysts that we track (only those with 4 and 5-star Nobias ratings) the average price target being applied to JPM shares right now is $154.33. Today, JPM shares trade for $131.12/share, meaning that this average price target implies 17.7% upside potential.
Disclosure: Nicholas Ward has no JPM position. Nicholas Ward wrote this article for Nobias at their request with a view of giving investors a balanced perspective based on the writings of Nobias highly rated analysts and bloggers. Nobias has no business relationship with any company whose stock is mentioned in this article and does not have a position in this stock.
Additional disclosure: All content is published and provided as an information source for investors capable of making their own investment decisions. None of the information offered should be construed to be advice or a recommendation that any particular security, portfolio of securities, transaction, or investment strategy is suitable for any specific person. The information offered is impersonal and not tailored to the investment needs of any specific person.
Disclaimer: The Nobias star rating is based on past performance results and is not an indicator of future results. These past performance returns do not represent returns that any investor actually earned. Assumptions made include the ability to purchase the stocks recommended by the author under liquid markets where the transaction would be at the market price for the day. In reality, loss in liquidity may have a material impact on the returns that actually may have been earned. Further, returns are calculated without any including transaction costs, management fees, performance fees or expenses, or reinvestment of dividends and other income. This information is provided for illustrative purposes only.
BLK With Nobias Technology: Case Study on BlackRock
BlackRock (BLK) posted its Q1 earnings last week. The company missed Wall Street’s consensus estimate on the top-line when it reported Q1 earnings last week; however, the company’s $4.7 billion revenue result still represented 6.8% year-over-year growth. BLK beat estimates on the bottom-line, posting non-GAAP earnings-per-share of $9.52, which came in $0.65/share ahead of the consensus analyst target.
BlackRock (BLK) posted its Q1 earnings last week. The company missed Wall Street’s consensus estimate on the top-line when it reported Q1 earnings last week; however, the company’s $4.7 billion revenue result still represented 6.8% year-over-year growth. BLK beat estimates on the bottom-line, posting non-GAAP earnings-per-share of $9.52, which came in $0.65/share ahead of the consensus analyst target.
During Q1, BLK’s EPS was up 20% on a diluted basis and 18% on an adjusted basis. At the end of Q1, BlackRock’s assets under management totaled $9.56 trillion. This was down from the $10.01 trillion that the company reported at the end of the fourth quarter. However, it was up on a year-over-year basis, compared to Q1 2021’s AUM total of $9.37 trillion. During Q1, BlackRock saw $86.3 billion of total net inflows. The company also highlighted $114 billion of “quarterly long-term net inflows”, which it said, “reflect[s] strength of broad-based platform with positive flows across all product types, investment styles and regions”.
With regard to BLK’s ~7% revenue growth, the company highlighted, “strong organic growth and 11% growth in technology services revenue, partially offset by lower performance fees”. During the Q1 earnings conference call, BlackRock’s CEO, Larry Fink, touched upon the ongoing strength that the company is seeing with its flagship iShares ETF brand, saying, “In the first quarter, we once again saw investors using ETFs to quickly allocate capital and the managed risk during periods of volatility. In the US, iShares’ secondary trading volumes were up nearly 40% compared to 2021 levels providing clients worldwide with the liquidity they needed in volatile markets.”

BLK April 2022
Fink noted that BLK’s ETF segment saw $56 billion in net inflows during the quarter, “with growth coming from each of our major product categories, including core strategic and precision ETFs.” During the conference call, BLK’s CFO, Gary Shedlin, highlighted the company’s strong operational results and then put a spotlight on shareholder returns saying, “Our capital management strategy remains, first, to invest in our business and then to return excess cash to shareholders through a combination of dividends and share repurchases.”
Shedlin continued, “We previously announced an 18% increase in our quarterly dividend to $4.88 per share of common stock and repurchased $500 million worth of common shares in the first quarter. At present, based on our capital spending plans for the year and subject to market conditions, including the relative valuation of our stock price, we still anticipate repurchasing at least $375 million of shares per quarter for the balance of the year consistent with our previous guidance in January.”
However, all of this talk of ongoing growth and strong shareholder returns wasn’t enough to buoy the stock. BlackRock shares fell 7.45% last week. This negative performance pushed the stock’s year-to-date performance down to -24.52%. However, even after this short-term weakness, the credible authors and analysts that the Nobias algorithm tracks continue to remain overwhelmingly bullish on BLK shares.
On March 31st, Nobias 4-star author, Cash Builders Opportunities, published an article at Seeking Alpha titled, “JPMorgan And BlackRock: 2 Financial Stocks Worth A Look”. The author touched upon BLK’s year-to-date weakness saying, “As the stock hit an all-time high and the overall uncertainty of the market in general, it makes sense that shares have fallen quite precipitously as of late. I believe that is opening up an excellent opportunity to pick up shares at a much lower price than where we were just a few months ago.”
Cash Builders Opportunities highlighted the company’s fundamental growth saying, “The higher earnings for BLK haven't only been asset appreciation. They have been receiving some massive inflows as well. For 2021, they noted that they had total net inflows of $540 billion. That helped translate into 20% higher revenue for the year and a 20% increase in diluted EPS. EPS from 2020 was $33.82, and in 2021, it came in at $39.18. Analysts are expecting for 2022 that BLK will see $41.40 in EPS.”
With regard to peace of mind during the current inflationary environment that we’re witnessing from a macro perspective at the moment, the author stated, “The growing dividends that beat out inflation are a huge selling point for a longer-term income investor.” With regard to BLK’s dividend growth history, they said, “They are going on 12 years of dividend growth. They did freeze their dividend for several quarters between 2008 and 2009. That resulted in a lack of annual increases, but they also didn't cut their dividend through that period.”
Nicholas Ward is a Senior Investment Analyst at Wide Moat Research. He has spent the last 8 years writing about the stock market at various publications, including Seeking Alpha, The Street, Forbes Real Estate Investor, Sure Dividend, The Dividend Kings, iREIT, Safe High Yield, and The Intelligent Dividend Investor.
This bullish sentiment is consistent with the aggregate outlook expressed by the 4 and 5-star authors that we track. Of the recent articles focused on BLK shares that have been published by credible authors tracked by the Nobias algorithm, 95% have included a “Bullish” bias.
Nobias 5-star rated Wall Street analyst, James Fotheringtham of BMO Capital, lowered his price target for BLK shares after the company’s earnings report; however, his updated $734 price target still represents ~7% upside from the stock’s current $668.17 share price.
The BMO Capital report stated, “The analyst is cutting his FY22 EPS view by 99c to $40.21 after the company's "low quality" Q1 earnings beat, though he still sees BlackRock as "well positioned for growth" across a broad array of products and themes. Fotheringham adds that the company will continue to steal share from its traditional asset management peers, but its multiple has "limited upside".
Overall, the average price target being applied to BLK shares by the credible analysts (only those with 4 or 5-star Nobias ratings) right now is $918.40. This average price target represents upside potential of approximately 33.5% compared to the stock’s current price.
Disclosure: Nicholas Ward is long BLK. Nicholas Ward wrote this article for Nobias at their request with a view of giving investors a balanced perspective based on the writings of Nobias highly rated analysts and bloggers. Nobias has no business relationship with any company whose stock is mentioned in this article and does not have a position in this stock.
Additional disclosure: All content is published and provided as an information source for investors capable of making their own investment decisions. None of the information offered should be construed to be advice or a recommendation that any particular security, portfolio of securities, transaction, or investment strategy is suitable for any specific person. The information offered is impersonal and not tailored to the investment needs of any specific person.
Disclaimer: The Nobias star rating is based on past performance results and is not an indicator of future results. These past performance returns do not represent returns that any investor actually earned. Assumptions made include the ability to purchase the stocks recommended by the author under liquid markets where the transaction would be at the market price for the day. In reality, loss in liquidity may have a material impact on the returns that actually may have been earned. Further, returns are calculated without any including transaction costs, management fees, performance fees or expenses, or reinvestment of dividends and other income. This information is provided for illustrative purposes only.
GME With Nobias Technology: Case Study on GameStop the first Meme stock
GameStop (GME) shares have been at the center of the recent “meme stock” craze that we’ve seen develop during recent years. GME shares have experienced massive volatility as traders buy and sell the stock using thesis that are largely based upon sentiment as opposed to the company’s underlying fundamentals. Today, GME shares trade for $146.19, which means that they are down roughly 57.5% from their 52-week high of $344.66. However, during the last month, GME shares have rallied more than 40%, showing that the volatility that they’ve become known for since 2020 remains in place.
GameStop (GME) shares have been at the center of the recent “meme stock” craze that we’ve seen develop during recent years. GME shares have experienced massive volatility as traders buy and sell the stock using thesis that are largely based upon sentiment as opposed to the company’s underlying fundamentals. Today, GME shares trade for $146.19, which means that they are down roughly 57.5% from their 52-week high of $344.66. However, during the last month, GME shares have rallied more than 40%, showing that the volatility that they’ve become known for since 2020 remains in place.
One of the strongest aspects of the bullish thesis for GME shares is the strength of its new leadership. Ryan Cohen is the chairman of GameStop’s Board of Directors and his involvement with the company fuels the bulls’ hopes.
Kevin Dowd, a Nobias 4-star rated author, recently published an article at Forbes which put a spotlight on Cohen and his very successful career. Dowd highlighted Cohen’s history, which began when he co-founded Chewy, a pet-oriented eCommerce site, in 2011, and eventually oversaw that company’s sale to PetSmart in 2017 for $3.35 billion. Later, Chewy IPOed as a stand alone company and during the pandemic period where eCommerce/stay-at-home stocks were all the rage, the company’s market cap soared to more than $50 billion.
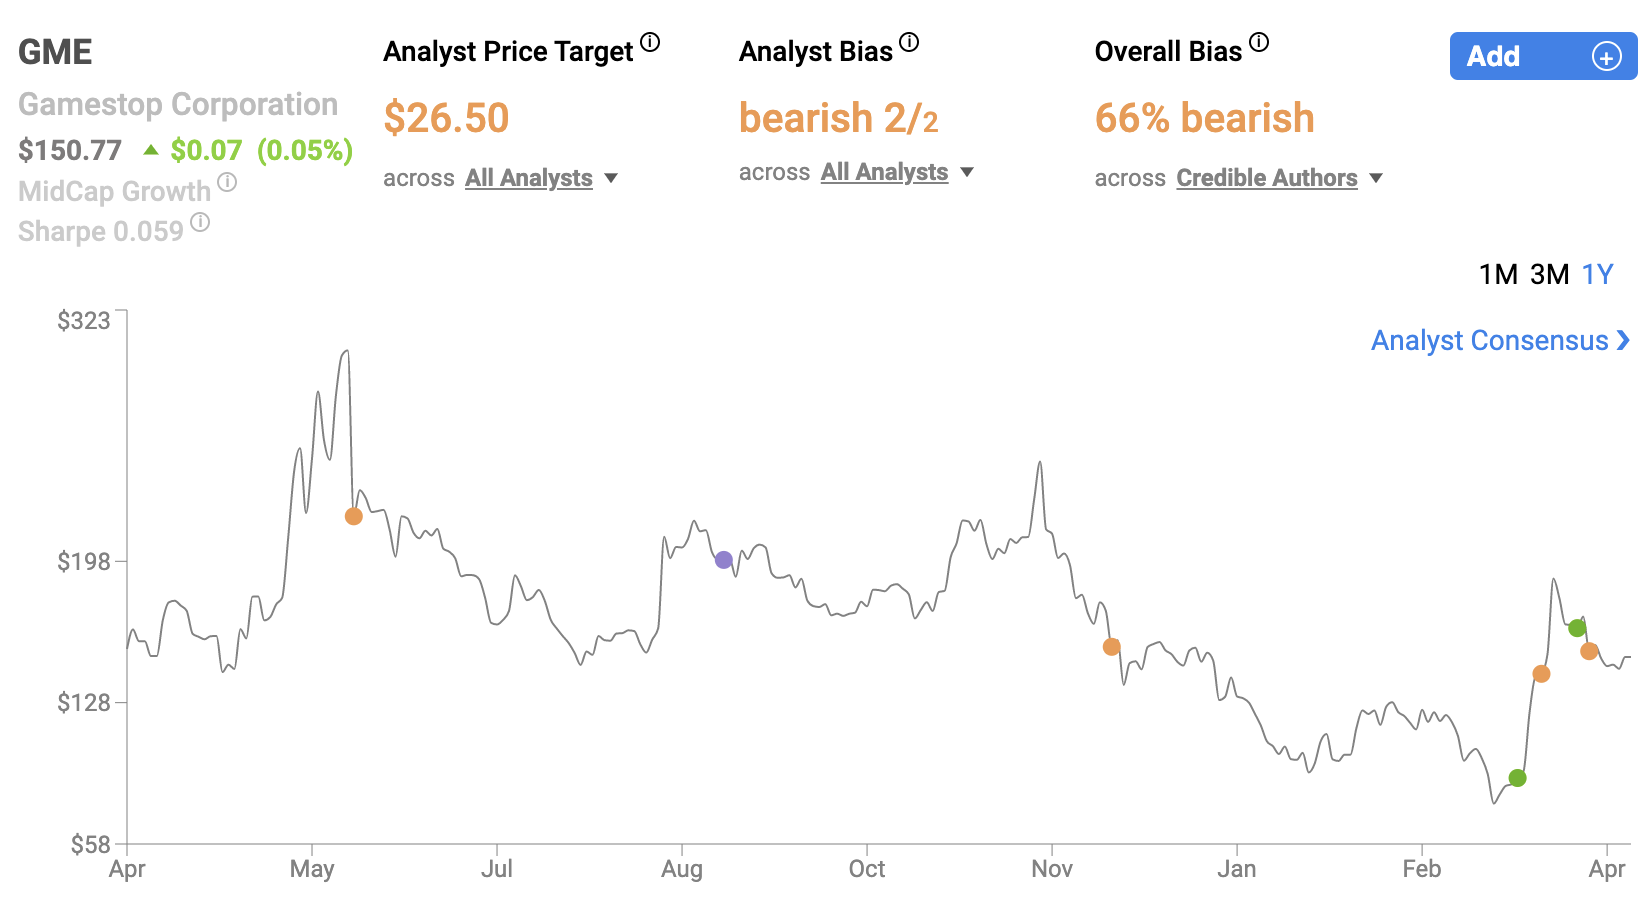
GME April 2022
At this point in time, Cohen was minted as a market darling - creating a sense amongst investors that anything he touches, turns to gold. Dowd touched upon Cohen’s plans to take advantage of this sentiment, by investing his billions into other broken down retail plays. One such investment was GameStop. Cohen’s involvement with that company stoked the meme-stock mania that we’ve seen attached to GME shares.
Regarding Cohen’s GME sage, Dowd wrote: “A few months later, Cohen divulged a roughly 10% stake in GameStop, a development the company’s backers greeted with enthusiasm—enthusiasm that helped launch one of the strangest sagas in finance history. The company’s stock soared after Cohen revealed his stake, and it continued to soar to in the months to come, as an informal armada of day-traders and other opportunists attempted a short squeeze that drove the share price up to gob-smacking levels and prompted a cascade of think-pieces pondering whether Wall Street would ever be the same. In April, Cohen was named GameStop’s chairman.
The short squeeze hasn’t quite worked—not yet, at least, not in the way the true believers expected. But the whole affair has been transformative for GameStop. The company’s stock spent most of 2020 trading for less than $10 per share. Today’s it’s above $100, giving GameStop a $7.7 billion market cap and providing the financial firepower required for Cohen & Co. to attempt an ambitious digital transformation.”
The fact that Cohen, and other high level insiders, continue to accumulate GME shares bolsters the bull thesis surrounding this stock. Ed Lin, a Nobias 4-star rated author, recently published an article at Barron’s highlighting recent insider purchases at GameStop. He said, “GameStop (ticker: GME) just saw its third insider stock purchase in as many days, and shares of the videogame retailer soared last week on news of the big buys.”
Lin continued, “GameStop director Alan Attal paid $195,000 on March 24 for 1,500 shares, an average price of $129.91 each, according to a form he filed with the Securities and Exchange Commission that day. Attal, a GameStop director since January 2021, now owns 130,423 GameStop shares.”
Finally, he added, “The other insider GameStop stock buys in recent days—bigger than Attal’s purchase—have been made by Cohen, and director Larry Cheng. Those stock purchases were disclosed on March 22 and 23, respectively. These insider purchases have likely factored into the recent 40% rally that GME shares have experienced.
The company’s recent Q4 report could also be factoring into the rally. When GME reported earnings on March 17th, 2022, the company beat Wall Street estimates on the top-line but missed consensus estimates on the bottom-line. GME posted sales of $2.25 billion, which were up by 6.1% on a year-over-year basis. GME’s non-GAAP earnings-per-share totaled -$1.86, missing estimates by $2.70/share. In other words, Wall Street was expecting a profit during Q4, but GME published a loss.
John Miller, a Nobias 5-star rated author published an article on GameStop, highlighting its recent quarterly results, on Seeking Alpha on March 22, 2022. In his piece, Miller touched upon GameStop’s strong holiday gaming sales, noting a quote by the company’s CEO, Matt Furlong from the Q4 report. Furlong said, “We have learned from the mistakes of the past decade when GameStop failed to adapt to the future of gaming... We've also had to change the way we assess revenue opportunities by starting to embrace, rather than run from, the new frontiers of gaming.”
Nicholas Ward is a Senior Investment Analyst at Wide Moat Research. He has spent the last 8 years writing about the stock market at various publications, including Seeking Alpha, The Street, Forbes Real Estate Investor, Sure Dividend, The Dividend Kings, iREIT, Safe High Yield, and The Intelligent Dividend Investor.
As great as the growth in gaming was, Miller was quick to point out that GameStop’s valuation remains very speculative. He highlighted the company’s recent fundamentals saying:
Revenue growth in 2021 was about 18% and one could legitimately argue a large part of the growth came from the reversal of Covid effects felt in 2020. Setting this aside, assume revenue growth of 35% to $8.1 billion.
The gross profit percentage in 2021 was 22%, though the trend in the second half of the year was down, primarily on added shipping costs assumed by the company.
SG&A for 2021 was up 13% to $1.7 billion.
Looking forward, Miller used these 2021 figures to formulate a theoretical valuation scenario for the shares, using a 35% revenue growth rate, 22% gross profit margin, and $1.7 billion in SG&A for 2022. He concluded, “The result of these assumptions is $100 million of hypothetical earnings. So, even if the $1.27 billion cash balance were backed out of the $6.9 billion market cap, the price to EBIT multiple would remain above 50. GameStop is substantially overpriced even under the most optimistic of near-term outlooks.”
When looking at the aggregate opinion expressed by the credible authors and Wall Street analysts (only those with 4 or 5-star Nobais ratings) that our algorithm tracks, it appears that the valuation issues surrounding GME shares result in stark pessimism regarding the stock’s prospects. 66% of recent articles published about the stock by credible authors have expressed “Bearish” sentiment. And, the average price target being applied to GME shares by credible analysts that we track is currently $30.00/share. Right now, GME shares trade for $146.19. Therefore, this average price target implies downside potential of nearly 80%.
Disclosure: Nicholas Ward has no GME position. Nicholas Ward wrote this article for Nobias at their request with a view of giving investors a balanced perspective based on the writings of Nobias highly rated analysts and bloggers. Nobias has no business relationship with any company whose stock is mentioned in this article and does not have a position in this stock.
Additional disclosure: All content is published and provided as an information source for investors capable of making their own investment decisions. None of the information offered should be construed to be advice or a recommendation that any particular security, portfolio of securities, transaction, or investment strategy is suitable for any specific person. The information offered is impersonal and not tailored to the investment needs of any specific person.
Disclaimer: The Nobias star rating is based on past performance results and is not an indicator of future results. These past performance returns do not represent returns that any investor actually earned. Assumptions made include the ability to purchase the stocks recommended by the author under liquid markets where the transaction would be at the market price for the day. In reality, loss in liquidity may have a material impact on the returns that actually may have been earned. Further, returns are calculated without any including transaction costs, management fees, performance fees or expenses, or reinvestment of dividends and other income. This information is provided for illustrative purposes only.
UPS With Nobias Technology: Case Study on UPS, a dividend paying company with growth opportunities
Shares of United Parcel Service, Inc (UPS) fell 6.47% this week. UPS shares are now down 10.55% on a year-to-date basis, underperforming the S&P 500, which has seen its value fall by 6.43% during 2022 thus far. However, even with this underperformance in mind, the credible authors and analysts tracked by the Nobias algorithm remain largely “Bullish” on UPS shares.
Shares of United Parcel Service, Inc (UPS) fell 6.47% this week. UPS shares are now down 10.55% on a year-to-date basis, underperforming the S&P 500, which has seen its value fall by 6.43% during 2022 thus far. However, even with this underperformance in mind, the credible authors and analysts tracked by the Nobias algorithm remain largely “Bullish” on UPS shares.
Sirisha Bhogaraju, A Nobias 5-star rated author recently published an article highlighting her bullish opinion on UPS shares. Bhogaraju began her piece saying, “United Parcel is a leading provider of package delivery services and global supply chain management solutions with an extensive presence in over 220 countries.” She also highlighted the strong performance that UPS shares have generated recently, writing, “UPS shares touched a new all-time high of $233.72 on February 1, as the company beat Q4 expectations, issued a robust outlook and raised its quarterly dividend by 49% to $1.52 per share. This dividend hike marked the largest increase in the company’s history.”
Regarding UPS’s fundamentals, Bhogaraju wrote, “UPS reported Q4 revenue of $27.8 billion, up 11.5% from the prior-year quarter and ahead of analysts’ estimates of $27 billion.” Bhogaraju continued, saying, “Adjusted EPS grew 35% to $3.59, beating analysts’ forecasts of $3.09.”

UPS April 2022
Looking ahead, Bhogaraju notes that UPS management expects to see growth continue. Bhogaraju wrote, “UPS expects revenue of about $102 billion in 2022, compared to $97.3 billion in 2021, and adjusted operating margin of about 13.7%, up from 13.5% in 2021.”
Regarding Wall Street’s outlook on the stock, Bhogaraju said, “Overall, the Street is cautiously optimistic on the stock, with a Moderate Buy consensus rating based on 11 Buys, eight Holds and one Sell. The average United Parcel price target of $241.35 suggests 12.42% upside potential from current levels.”
Bhogaraju also covered the upside potential of UPS’s largest rivals, FedEx (FDX) and XPO Logistics (XPO). She said, “The average FedEx price target of $295.75 implies 31% upside potential from current levels.” She also said, “The average XPO Logistics price target of $99.27 implies 30.2% upside potential from current levels. Therefore, as great as UPS’s recent performance has been, it’s clear that the company continues to face strong competition in its industry which could pose a threat to growth moving forward.
Although competition in the logistics space remains fierce, UPS continues to use innovation and forward thinking partnerships to attempt to solve problems, especially with regard to carbon emissions and the “last mile” conundrum that has vexed so many delivery companies (regarding difficulties with the last several miles of deliveries, from large logistics facilities to consumers’ doorsteps in a profitable manner).
In a recent Yahoo Finance article, Nobias 4-star rated author, Nick Carey, highlighted some of UPS’s recent attempts to solve such issues. Carey noted that Luke Wake, UPS vice president of fleet maintenance and engineering, recently told Reuters that the company is trailing roughly 100 electronic bikes, built by the British firm Fernhay, as a means to make last mile deliveries.
Carey wrote, “As well as making public commitments to cut their carbon footprints, package-delivery companies are seeking new ways to cut the cost of last-mile deliveries amid soaring e-commerce orders.” Touching upon one of the benefits of the eBike program, Carey said, “The vehicle is only 36 inches (91 cm) wide, so can legally use bike lanes and enter pedestrian zones that UPS' vans and trucks cannot access. Under normal circumstances, drivers would have to get out of their vehicles, load packages on carts and haul them to customers.”
Carey quoted Wake, who said, "There are more and more opportunities for zero-emission solutions like this that can alleviate inner-city congestion.” Carey also notes that UPS is also working with electric van makers like UK startups Arrival and Tevva, plus U.S. truck maker Xos. It’s this forward-thinking management style which has allowed UPS to generate reliable growth throughout its history.
Khen Elazar, a Nobias 5-star rated author, recently published an article at Seeking Alpha titled, “UPS Is A Decent Addition To Your Dividend Growth Portfolio” which put a spotlight on UPS’s historical results. Regarding UPS’s top-line, Elazar said, “Revenues have shown decent mid-single-digits annual growth over the last decade. It amounted to an 81% increase in sales over the last ten years. The company's growth rate is mainly organic and is derived by a higher volume of shipments and the addition of value-added services to clients. Going forward, the consensus of analysts, as seen on Seeking Alpha, expects UPS to keep growing sales at an annual rate of ~4% in the medium term.”
Moving to the bottom-line results, Elazar continued, “The EPS (earnings per share) has increased at a much faster rate than the company's sales. The company's EPS has almost quadrupled, with a significant almost 50% EPS increase in 2021. The reason for such a fast growth rate was the margin expansion over the past decade and particularly in 2021. It has happened due to the company's additional services, and the price increases we see across the board in logistics. Going forward, the consensus of analysts,, expects UPS to keep growing EPS at an annual rate of ~5% in the medium term.” And, he notes, this operational success has trickled down into the pockets of shareholders via a reliable increasing dividend.
Elazar said, “The dividend is another bright point for UPS investors. The company has been increasing dividends for twelve years, and the reason the streak isn't longer is that it froze its dividend for one year during the financial crisis. The company hasn't reduced the dividend for over twenty years. In 2021, the dividend was raised by 49% in line with the EPS growth to maintain a 50% payout in the coming twelve months. Investors should expect mid-single digits dividend growth rate in line with the company's EPS growth.” He also noted that UPS has used shareholder buybacks to retire approximately 10% of its outstanding shares over the prior decade.
Elazar concluded his article with a bullish outlook, saying, “UPS is a great company across the board. The company shows strong fundamentals that lead to an ever-growing ability to return capital to shareholders in the form of buybacks and dividends. In addition, it has several significant growth opportunities and high barriers to entry. Therefore, I believe that due to the limited risks, UPS is poised to keep performing.”
Nicholas Ward is a Senior Investment Analyst at Wide Moat Research. He has spent the last 8 years writing about the stock market at various publications, including Seeking Alpha, The Street, Forbes Real Estate Investor, Sure Dividend, The Dividend Kings, iREIT, Safe High Yield, and The Intelligent Dividend Investor.
BOOX Research, a Nobias 4-star rated author, also recently posted a bullish article on UPS at Seeking Alpha. In their article, BOOX noted that UPS shares are trading with a 16.0x forward price-to-earnings ratio, which, in their opinion, represents an attractive entry. BOOX Research wrote: “As it relates to valuation, we note that UPS's current forward P/E ratio and 1-year forward P/E based on the 2023 consensus EPS is below the 5-year average for the multiple closer to 22x. The dynamic can also be observed in UPS's EV to EBITDA multiple at 9.6x and 11.4x on a forward basis, which are both below the 5-year average closer to 13.5x. While the valuation multiples are slightly skewed by depressed earnings during the height of the pandemic in 2020, a more normalized range between 2015 and 2019 closer to 21x still suggests UPS is simply undervalued.”
BOOX’s research highlighted their bullish stance in the conclusion to their note as well, saying: “We rate UPS as a buy with a year ahead price target of $260 representing a forward P/E of 20x on the current 2022 consensus earnings. We like UPS as a unique "blue chip" defined by its leadership position, steady growth, solid fundamentals, and positive long-term outlook. These factors should allow shares to continue commanding a premium to the market with upside to its current valuation. The dividend increase with a yield near 3% adds to the allure of the stock for diversified portfolios.”
Looking at the opinions expressed by the credible authors and Wall Street analysts (only those with Nobias 4 and 5-star ratings) that our algorithm tracks, this bullish sentiment appears to be widely held. 92% of the recent articles published by credible authors have expressed “Bullish” bias. And, looking at the credible analysts that we track, the average price target being applied to UPS shares is $271.67. Relative to UPS’s current share price of $190.97, this consensus price target represents upside potential of approximately 42.25%.
Disclosure: Nicholas Ward has no position in any stock mentioned in this article. Nicholas Ward wrote this article for Nobias at their request with a view of giving investors a balanced perspective based on the writings of Nobias highly rated analysts and bloggers. Nobias has no business relationship with any company whose stock is mentioned in this article and does not have a position in this stock.
Additional disclosure: All content is published and provided as an information source for investors capable of making their own investment decisions. None of the information offered should be construed to be advice or a recommendation that any particular security, portfolio of securities, transaction, or investment strategy is suitable for any specific person. The information offered is impersonal and not tailored to the investment needs of any specific person.
Disclaimer: The Nobias star rating is based on past performance results and is not an indicator of future results. These past performance returns do not represent returns that any investor actually earned. Assumptions made include the ability to purchase the stocks recommended by the author under liquid markets where the transaction would be at the market price for the day. In reality, loss in liquidity may have a material impact on the returns that actually may have been earned. Further, returns are calculated without any including transaction costs, management fees, performance fees or expenses, or reinvestment of dividends and other income. This information is provided for illustrative purposes only.
UBER With Nobias Technology: Case Study on Uber's Deal with NYC Taxi
Uber (UBER) shares have experienced a significant rally in recent weeks. During the past month, UBER shares are up 17.97%. It appears that much of this bullish sentiment is centered around recent news related to a deal struck between this ride sharing company and taxi companies in New York City. However, even after this recent run-up in share price, UBER shares are still down 18.13% on a year-to-date basis. UBER is down approximately 41.5% from their 52-week highs of $61.50. In the company’s most recent quarter, Uber shifted towards profitability. Since then, we’ve seen a series of analyst upgrades. The credible author and analysts that Nobias tracks with our algorithm continue to express strong bullish sentiment for shares, with an average price target being applied to Uber that represents upside potential of nearly 76%.
Uber (UBER) shares have experienced a significant rally in recent weeks. During the past month, UBER shares are up 17.97%. It appears that much of this bullish sentiment is centered around recent news related to a deal struck between this ride sharing company and taxi companies in New York City. However, even after this recent run-up in share price, UBER shares are still down 18.13% on a year-to-date basis. UBER is down approximately 41.5% from their 52-week highs of $61.50. In the company’s most recent quarter, Uber shifted towards profitability. Since then, we’ve seen a series of analyst upgrades. The credible author and analysts that Nobias tracks with our algorithm continue to express strong bullish sentiment for shares, with an average price target being applied to Uber that represents upside potential of nearly 76%.
In mid-February, Uber posted its Q4/Full-year earnings results, beating analyst consensus estimates on both the top and bottom lines. UBER posted revenue of $5.78 billion, beating Wall Street’s estimate by $420 million, representing 82.3% year-over-year growth. Uber’s non-GAAP earnings-per-share came in at $0.44, beating analyst estimates by $0.77/share.
The company highlighted this profit immediately within the earnings report saying: “Gross Bookings of $25.9 billion, up 51% year-over-year and at the high end of the guidance range. Net income of $892 million, including a $1.4 billion net benefit relating to Uber’s equity investments. Adjusted EBITDA of $86 million was above the guidance range, with Delivery reaching Adjusted EBITDA profitability for Q4”

UBER April 2022
During the Q4 report, Uber’s CEO, Dara Khosrowshahi, said: “Our results demonstrate just how far we’ve come since the beginning of the pandemic. In Q4, more consumers were active on our platform than ever before, Delivery reached Adjusted EBITDA profitability, and Mobility Gross Bookings approached pre-pandemic levels. While the Omicron variant began to impact our business in late December, Mobility is already starting to bounce back, with Gross Bookings up 25% month-on-month in the most recent week.”
Nelson Chai, Uber’s CFO, said, ““We outperformed our quarterly guidance and delivered $540 million of Adjusted EBITDA improvement compared to Q4 of last year. Moving forward, we are poised to continue to grow at scale while expanding profitability.”
Steven Smith, a Nobias 5-star rated author, touched upon Uber’s business model in a recent article published at Modern Readers, saying: Uber Technologies, Inc develops and operates proprietary technology applications in the United States, Canada, Latin America, Europe, the Middle East, Africa, and the Asia Pacific. It connects consumers with independent providers of ride services for ridesharing services; and connects riders and other consumers with restaurants, grocers, and other stores with delivery service providers for meal preparation, grocery, and other delivery services.
In his piece Smith also highlighted recent analyst activity with regard to price target updates for UBER shares. He wrote:
BTIG Research cut their price objective on Uber Technologies from $80.00 to $65.00 and set a “buy” rating for the company in a research report on Thursday, February 10th.
Royal Bank of Canada cut their price objective on Uber Technologies from $65.00 to $50.00 and set an “outperform” rating for the company in a research report on Monday, March 21st. Canaccord Genuity Group cut their price target on Uber Technologies from $75.00 to $65.00 and set a “buy” rating for the company in a report on Thursday, February 10th.
KeyCorp cut their price target on Uber Technologies from $75.00 to $65.00 and set an “overweight” rating for the company in a report on Thursday, January 20th.
inally, JPMorgan Chase & Co. cut their price target on Uber Technologies from $72.00 to $68.00 and set an “overweight” rating for the company in a report on Wednesday, December 15th.
Overall, Smith said, “One investment analyst has rated the stock with a hold rating and thirty have issued a buy rating to the stock. According to MarketBeat, Uber Technologies presently has an average rating of “Buy” and a consensus price target of $64.07.”
On March 21st, 2022, Julian Lin, A Nobias 4-star rated author, published an article at Seeking Alpha which highlighted his bullish thesis on shares. Lin stated, “At around $33 per share, the stock is much lower than the $45 IPO price of 3 years ago. Yet since then, the company has grown revenues by over 30% while improving its cash flow generation profile. With significant torque to an ongoing pandemic recovery, UBER looks highly buyable here.”
Nicholas Ward is a Senior Investment Analyst at Wide Moat Research. He has spent the last 8 years writing about the stock market at various publications, including Seeking Alpha, The Street, Forbes Real Estate Investor, Sure Dividend, The Dividend Kings, iREIT, Safe High Yield, and The Intelligent Dividend Investor.
Lin noted that Uber’s profit margin was a surprise during the company’s recent Q4 report.He wrote, “That surprise non-GAAP profit was largely due to UBER having aggressively rationalized its cost structure during the pandemic, as it was forced to employ cash-preservation strategies when its mobility business came to a stand still. While the company continues to recover from the pandemic, it has sustained its margin improvements.”
This factors into his bullish sentiment. Lin said that Wall Street analysts expect for this profitability growth trend to continue. He wrote, “Wall Street expects UBER to earn a net margin of 8.5% by 2027 and 12% by 2031.” And, looking towards the future, Lin wrote, “Looking ahead, I expect UBER to see continued growth from all 3 of its business lines, with the strongest near term growth coming from its mobility business as travel returns to pre-pandemic levels.” He continued, “As we move beyond the pandemic, investors should return their attention to the fact that ridesharing remains a long term secular growth opportunity, with penetration still very low even in the United States.”
Lin isn’t alone in his bullish bias. 94% of the articles recently posted by credible authors (those with Nobias 4 and 5-star ratings) focused on Uber have included “Bullish” sentiment. And, looking at the credible Wall Street analysts that our algorithm tracks (once again, only those with Nobias 4 and 5-star ratings) we see that the average price target being applied to UBER shares is $63.25.
Today, UBER trades for $32.05. This means that the $63.25 price target mentioned above represents upside potential of more than 95%!
Disclosure: Nicholas Ward has no UBER position. Nicholas Ward wrote this article for Nobias at their request with a view of giving investors a balanced perspective based on the writings of Nobias highly rated analysts and bloggers. Nobias has no business relationship with any company whose stock is mentioned in this article and does not have a position in this stock.
Additional disclosure: All content is published and provided as an information source for investors capable of making their own investment decisions. None of the information offered should be construed to be advice or a recommendation that any particular security, portfolio of securities, transaction, or investment strategy is suitable for any specific person. The information offered is impersonal and not tailored to the investment needs of any specific person.
Disclaimer: The Nobias star rating is based on past performance results and is not an indicator of future results. These past performance returns do not represent returns that any investor actually earned. Assumptions made include the ability to purchase the stocks recommended by the author under liquid markets where the transaction would be at the market price for the day. In reality, loss in liquidity may have a material impact on the returns that actually may have been earned. Further, returns are calculated without any including transaction costs, management fees, performance fees or expenses, or reinvestment of dividends and other income. This information is provided for illustrative purposes only.
LULU With Nobias Technology: Case Study on Lululemon after their Earnings release
Throughout much of 2022, the apparel space has suffered. The negative share price performance that top names in this space have produced on a year-to-date basis have been largely due to fears surrounding supply chain headwinds which are causing problems for inventories as well as shipping costs. To meet Q4 demand, retailers and apparel stocks have had to do things like commission air freight to meet holiday season shopping demand. Doing so has damaged margins. Furthermore, recent COVID-19 spikes in Asia have created more uncertainty with regard to production of goods and if there’s one thing Wall Street hates, it’s uncertainty. However, over the last month or so, we’ve seen a stark turnaround when it comes to the sentiment surrounding this area of the market.
Throughout much of 2022, the apparel space has suffered. The negative share price performance that top names in this space have produced on a year-to-date basis have been largely due to fears surrounding supply chain headwinds which are causing problems for inventories as well as shipping costs. To meet Q4 demand, retailers and apparel stocks have had to do things like commission air freight to meet holiday season shopping demand. Doing so has damaged margins. Furthermore, recent COVID-19 spikes in Asia have created more uncertainty with regard to production of goods and if there’s one thing Wall Street hates, it’s uncertainty. However, over the last month or so, we’ve seen a stark turnaround when it comes to the sentiment surrounding this area of the market.
For instance, Lululemon (LULU) shares are up roughly 24.5% during the trailing month, having bounced off of their mid-March lows in the $290 area to the $370 level where shares sit today. The fourth quarter earnings results that LULU posted on March 29th have factored into the latest leg of this bull run. And, looking at the opinions expressed by the credible authors and Wall Street analysts that the Nobias algorithm tracks, it appears that LULU’s rally has more room to run.
On March 29th, LULU posted results which matched analyst consensus estimates on the top-line and beat Wall Street’s expectations on the bottom-line. LULU’s Q4 revenue totaled $2.13 billion, which was in-line with estimates and represented year-over-year growth of 23.1%. LULU’s Q4 non-GAAP earnings-per-share came in at $3.37, beating consensus estimates by $0.10/share, and representing 30.6% y/y growth compared to 2020’s Q4 EPS result of $2.58. LULU noted that total comparable sales rose by 22% during Q4. The company’s sale-store-sales were up by 32% during the quarter.

LULU April 2022
The company’s earnings report stated, ‘Gross profit increased 22% to $1.2 billion, and gross margin decreased 50 basis points to 58.1%.” LULU also noted that, “Operating margin increased 120 basis points to 27.7%. Adjusted operating margin increased 90 basis points to 27.8%.” And, with those rising margins in mind, LULU said, “Income from operations increased 29% to $590.6 million. Adjusted income from operations increased 27% to $592.0 million.” For the full-year, LULU’s revenues totaled $6.3 billion, up 42% year-over-year.
With regard to full-year profits, LULU said, “Income from operations increased 63% to $1.3 billion. Adjusted income from operations increased 62% to $1.4 billion”. LULU touched on plans to use the rising profits to reward shareholders, announcing a stock buyback authorization of $1 billion during the quarter. The company’s CEO, Calvin McDonald, was quoted during the Q4 report saying: "2021 was another successful year for lululemon, which speaks to the enduring strength of our brand and our ability to deliver sustained growth across the business. We are proud that we passed the $6 billion in annual revenue milestone for the first time, and successfully achieved our Power of Three growth target ahead of schedule. This was especially impressive given the challenging macro backdrop. We are entering the new year from a position of strength, which we’ll build upon to continue delivering for our guests and shareholders in the years to come." The company’s rising profits, alongside management’s confidence, appears to have set the stage for a strong post-earnings rally; LULU shares bounced roughly 7% on the Q4 results.
After LULU’s recent rally, in a recent article published at Nasdaq.com, John Ballard, a Nobias 4-star rated author, notes that “The stock is currently down 4.8% year to date, outperforming the Nasdaq Composite that is down 8.2%.” At a high level, Ballard provided a history lesson on LULU shares saying: “Lululemon has been a tremendous success story since its founding with a single selling space in a yoga studio in Vancouver more than 20 years ago. It continues to gradually expand its store footprint, opening 22 new stores last quarter across Asia Pacific, North America, and Europe, bringing the total to 574 worldwide. It also has a strong online presence that generated 49% of total revenue last quarter.”
Today, LULU sports a $48.5 billion market cap, showing the company’s massive success in recent years (LULU shares are up 647.95% during the past 5 years alone). Ballard highlighted Lululemon’s ongoing innovation, pointings towards the company’s recent entry into the athletic footwear market as a potential long-term growth tailwind for the stock. He wrote, “Lululemon introduced its new women's footwear line called Blissfeel in early March. While it's still early, management reported that the guest response has exceeded their expectations.” Ballard continued, “By going after the women's market first, with a men's shoe scheduled to launch in 2023, Lululemon believes it has an opportunity to make a big splash in this competitive market.”
In his piece, Ballard quoted LULU’s Chief Product Officer, Sun Choe, who touched upon the company’s goals to take market share in an area of the market where the company believes consumers are underserved, saying, "We intentionally started with women first because we saw an opportunity to solve for the fact that, more often than not, performance shoes are designed for men and then adapted for women.” Regarding upside potential, Ballard said, “Overall, Lululemon is a tiny $6 billion brand operating in an athletic wear industry that generates nearly $200 billion in annual revenue.”
Overall, Ballard concluded his bullish piece saying: “Lululemon is a relatively low-risk investment with big return potential. It has proven itself for 20 years with steady growth, and most importantly, the brand is showing universal appeal as it expands everywhere from China to Europe. Investors who buy and hold this retail stock should beat the market's average return soundly over the next 20 years.”
Brian Himes, a Nobias 5-star rated author, published an article at The Stock Observer on 4/2/2022 showing that Ballard isn’t alone with his bullish opinion of LULU shares. Himes said, “Lululemon Athletica had its price objective lifted by Robert W. Baird from $425.00 to $450.00 in a research report released on Wednesday.” He continued, putting a spotlight on a slew of recent analyst price target changes. Many of the analysts that he covers recently lowered their price targets; however, their fair value estimates still point towards strong upside from LULU’s current $370.36 price tag.
Himes wrote:
JPMorgan Chase & Co. lowered their target price on shares of Lululemon Athletica from $518.00 to $450.00 in a research note on Tuesday, January 11th.
Morgan Stanley lowered their target price on shares of Lululemon Athletica from $404.00 to $300.00 and set an equal weight rating on the stock in a research note on Tuesday, January 11th.Deutsche Bank Aktiengesellschaft lowered their target price on shares of Lululemon Athletica from $453.00 to $410.00 and set a buy rating on the stock in a research note on Thursday, March 24th.
B. Riley decreased their price objective on shares of Lululemon Athletica from $548.00 to $487.00 in a research note on Friday, January 7th.
Wells Fargo & Company upped their price objective on shares of Lululemon Athletica from $410.00 to $420.00 and gave the stock an equal weight rating in a research note on Friday, December 10th.
Nicholas Ward is a Senior Investment Analyst at Wide Moat Research. He has spent the last 8 years writing about the stock market at various publications, including Seeking Alpha, The Street, Forbes Real Estate Investor, Sure Dividend, The Dividend Kings, iREIT, Safe High Yield, and The Intelligent Dividend Investor.
Overall, Himes said, “One analyst has rated the stock with a sell rating, seven have given a hold rating and nineteen have issued a buy rating to the stock. Based on data from MarketBeat, the stock presently has an average rating of Buy and an average price target of $435.28.”
Looking at the credible analysts that the Nobias algorithm tracks (just those with 4 and 5-star ratings) we’ve seen 8 individuals update their LULU price targets since Lululemon’s recent fourth quarter results. The average price target of those credible analysts is $449.37.
When looking at price targets established both before and after LULU’s recent quarterly results, we see an average price target of $460.80 being applied to LULU shares by Nobias credible analysts. Relative to LULU’s current share price, that average price target represents upside potential of approximately 24.4%.
And, it’s not just credible Wall Street analysts who are bullish here. 88% of recent articles published by the credible authors (once again, only individuals with 4 and 5-star Nobias ratings) have included a “Bullish” bias rating.
Disclosure: Nicholas Ward has no LULU position. Nicholas Ward wrote this article for Nobias at their request with a view of giving investors a balanced perspective based on the writings of Nobias highly rated analysts and bloggers. Nobias has no business relationship with any company whose stock is mentioned in this article and does not have a position in this stock.
Additional disclosure: All content is published and provided as an information source for investors capable of making their own investment decisions. None of the information offered should be construed to be advice or a recommendation that any particular security, portfolio of securities, transaction, or investment strategy is suitable for any specific person. The information offered is impersonal and not tailored to the investment needs of any specific person.
Disclaimer: The Nobias star rating is based on past performance results and is not an indicator of future results. These past performance returns do not represent returns that any investor actually earned. Assumptions made include the ability to purchase the stocks recommended by the author under liquid markets where the transaction would be at the market price for the day. In reality, loss in liquidity may have a material impact on the returns that actually may have been earned. Further, returns are calculated without any including transaction costs, management fees, performance fees or expenses, or reinvestment of dividends and other income. This information is provided for illustrative purposes only.
OKTA with Nobias Technology: Case study of Okta Inc. Sell-off
The cybersecurity industry continues to experience stellar growth. However, OKTA shares have suffered on a year-to-date basis, down more than 33%. OKTA's top-line is expected to grow rapidly in fiscal 2023; however, the company's losses are expanding. But, Wall Street analysts remain optimistic on these beaten down shares, with average price targets calling for strong double digit upside.
The cybersecurity industry continues to experience stellar growth.
However, OKTA shares have suffered on a year-to-date basis, down more than 33%.
OKTA's top-line is expected to grow rapidly in fiscal 2023; however, the company's losses are expanding.
But, Wall Street analysts remain optimistic on these beaten down shares, with average price targets calling for strong double digit upside
Cybersecurity firms have experienced tremendous growth in recent years and many analysts believe that this trend has secular tailwinds. Overall, the Global X Cybersecurity ETF (BUG) has generated relatively flat returns on a year-to-date basis. Yet, throughout 2022, many of the rapidly growing cybersecurity with somewhat speculative valuations attached have suffered. Okta, Inc, a cybersecurity firm with a market cap of $23.91 billion, has seen the value of its shares decline by 33.29% this year. Okta reported fourth quarter earnings one month ago and since then, the stock’s sell-off has accelerated, with shares falling more than 12%. However, in the face of this share price weakness, the credible authors and analysts that Nobias tracks have expressed strong bullish sentiment towards the beaten down OKTA shares.
Reinhardt Krause, a Nobias 5-star rated author, wrote an article at Investors.com on 3/3/2022 highlighting OKTA’s recent earnings report. Regarding Okta’s business model, Krause wrote, “Okta's cybersecurity software monitors and manages privileged accounts. Hackers often target employees or management with administrative access to company computer systems.”
Moving onto the company’s fourth quarter results, he said, “Okta stock fell Thursday as fiscal 2023 profit guidance came in well below expectations despite the company reporting a narrower-than-expected loss for its January quarter.” He touched upon the results, saying, “San Francisco-based Okta said it lost 18 cents per share vs. a 6-cent profit in the year-earlier period. Revenue climbed 63% to $383 million, including $56 million from Auth0, the company said.”

OKTA March 2022
With regard to fiscal 2023 guidance, Krause said, “For the current, full-year fiscal 2023 which ends next January, Okta predicted a loss in a range of $1.24 to $1.27 per share. Analysts had projected a 49-cent loss.” While the bottom-line guidance was disappointing, Krause did point out that Okta is still falling for strong revenue growth. He said, “The company projected revenue of $1.785 billion, up 38%. Analysts predicted $1.75 billion.”
However, it appears that the market has been more focused on the prospect of expanding losses as opposed to the strong top-line growth because since Okta reported results on 3/3/2022, shares are down roughly 12.6%. These widening losses are largely due to rising capex related to an increasing headcount at this rapidly growing company.
Joe Williams, a Nobias 5-star rated author, published an article at Yahoo Finance on March 3rd highlighting what Okta’s CEO, Todd McKinnon, described as an “awkward adolescent” stage of growth, related to management turnover and the upcoming hiring push.
Williams highlighted double digit turnover in recent years at OKTA (11% in 2019, 19% in 2020, and 20% in 2021), saying that this has been a somewhat typical occurrence in Silicon Valley throughout the pandemic, but noting, “at Okta, founded in 2009, the turnover also hit at something deeper: The company is trying to jump from $1 billion in annual revenue to a goal of $5 billion.”
Regarding upper level management changes, Williams said, “A cadre of long-time executives have left, including former finance head Bill Losch and worldwide head of operations Charles Race. Okta has largely looked outside its workforce for replacements. Former Splunk Inc. president Susan St. Ledger was hired to take over for Race and fulfill the mission to get to reach the new sales target. And after 10 years at Okta, technology head Hector Aguilar left and former Alphabet Inc. executive Sagnik Nandy took his spot.” He quoted McKinnon, who touched upon the hiring issues that the company has had in recent years during the Q4 reporting season, saying, “We just didn’t have the experience. You can either bet on someone that hasn’t done it before or you can try to find someone amazing.”
It’s believed that these exits has slowed growth and negatively impacted the integration of recent M&A that Okta has pursued; however, Williams provided some bullish insight, saying, “The impact of the exits may be a short-term blimp: Okta is planning to hire more employees this year as it expands the sales force and amps up investments in marketing. Spending in that area rose 92% to $221 million in the period ended Jan. 31, Okta said Wednesday in its statement of quarterly results.”
Once again, the uncertainty associated with talent and ongoing turnover at Okta has hurt the sentiment surrounding shares in the market; however, as Steven Smith, a Nobias 5-star rated author, noted in a recent report, Wall Street analysts are still largely bullish on OKTA shares. In the article that Smith published a report at Modern Readers, he highlighted a series of recent analyst updates on OKTA shares in light of this Q4 report. His points include:
Raymond James lowered their target price on shares of Okta from $310.00 to $260.00 and set a “strong-buy” rating on the stock in a research note on Thursday, March 3rd.
Deutsche Bank Aktiengesellschaft reduced their target price on Okta from $250.00 to $195.00 and set a “buy” rating on the stock in a research note on Thursday, March 3rd.
DA Davidson dropped their price target on Okta from $250.00 to $225.00 in a research note on Thursday, March 3rd.
Overall, Smith said, “Six investment analysts have rated the stock with a hold rating, twenty-two have assigned a buy rating and one has given a strong buy rating to the company. Based on data from MarketBeat, the stock has a consensus rating of “Buy” and a consensus target price of $247.81.”
Nicholas Ward is a Senior Investment Analyst at Wide Moat Research. He has spent the last 8 years writing about the stock market at various publications, including Seeking Alpha, The Street, Forbes Real Estate Investor, Sure Dividend, The Dividend Kings, iREIT, Safe High Yield, and The Intelligent Dividend Investor.
Smith also went on to highlight recent insider sales that he saw related to Okta. He wrote, ‘CFO Brett Tighe sold 2,858 shares of Okta stock in a transaction on Wednesday, March 16th. The stock was sold at an average price of $152.92, for a total transaction of $437,045.36. The sale was disclosed in a legal filing with the Securities & Exchange Commission, accessible through here. Also, General Counsel Jonathan T. Runyan sold 2,010 shares of the business’s stock in a transaction on Wednesday, March 16th. The stock was sold at an average price of $152.92, for a total value of $307,369.20. The disclosure for this sale can be found here.” Overall, he said, “Over the last three months, insiders have sold 19,437 shares of company stock valued at $2,972,306. 9.60% of the stock is currently owned by corporate insiders.”
Although insiders have been selling, the data collected by the Nobias algorithm shows that both credible authors and analysts (only those with Nobias 4 and 5-star ratings) remain largely bullish on OKTA shares. 81% of the articles published by credible authors focused on OKTA shares recently have included a “Bullish” bias. And, looking at the price targets that the credible Wall Street analysts that we track have placed on OKTA shares, we see an average price target of $228.45. This is slightly lower than the consensus target that Smith mentioned above; however, it’s still well above OKTA’s current share price of $148.12. Relative to the current share price, the average price target applied to shares by the credible analysts that Nobias tracks represents upside potential of 54.2%.
Disclosure: Nicholas Ward has no OKTA position. Nicholas Ward wrote this article for Nobias at their request with a view of giving investors a balanced perspective based on the writings of Nobias highly rated analysts and bloggers. Nobias has no business relationship with any company whose stock is mentioned in this article and does not have a position in this stock.
Additional disclosure: All content is published and provided as an information source for investors capable of making their own investment decisions. None of the information offered should be construed to be advice or a recommendation that any particular security, portfolio of securities, transaction, or investment strategy is suitable for any specific person. The information offered is impersonal and not tailored to the investment needs of any specific person.
Disclaimer: The Nobias star rating is based on past performance results and is not an indicator of future results. These past performance returns do not represent returns that any investor actually earned. Assumptions made include the ability to purchase the stocks recommended by the author under liquid markets where the transaction would be at the market price for the day. In reality, loss in liquidity may have a material impact on the returns that actually may have been earned. Further, returns are calculated without any including transaction costs, management fees, performance fees or expenses, or reinvestment of dividends and other income. This information is provided for illustrative purposes only.
AMZN with Nobias Technology: Case study of Amazon after stock split and buyback announcement
Amazon shares have outperformed the major averages by a wide margin over the long-term.
However, during the trailing 12 months, AMZN shares have underperformed.
Analysts believe that the recent stock split and buyback announcement has the potential to change this bearish momentum.
Amazon shares have outperformed the major averages by a wide margin over the long-term.
However, during the trailing 12 months, AMZN shares have underperformed.
Analysts believe that the recent stock split and buyback announcement has the potential to change this bearish momentum.
After a decade of massive outperformance, Amazon (AMZN) shares have seen stagnating share price appreciation in recent years. During the trailing 10-year period, AMZN shares have generated total returns of 1,566.68%, beating the S&P 500’s 225.95 10-year performance by a wide margin. However, during the trailing 12 months, AMZN has underperformed, posting 8.02% gains as opposed to the S&P 500’s 15.98% growth. Amazon posted tremendous fundamental growth during the COVID-19 period, with its earnings-per-share rising by 82% in 2020 and another 55% on top of that in 2021. However, this bottom-line growth hasn’t been enough to push its share price higher.
And yet, even with recent underperformance in mind, the credible authors and analysts that we track with the Nobias algorithm continue to express very positive sentiment when it comes to Amazon stock. 82% of recent articles published by credible authors (those with 4 and 5-star Nobias ratings) have included a “Bullish” rating. And, the average price targeting being applied to Amazon shares by credible analysts that the Nobias algorithm tracks is currently $4,163.93. When compared to Amazon’s current share price of $3,295.87, this represents upside potential of approximately 26.3%.
Looking at recent reports published on the stock, it’s clear that a couple of recent announcements made by Amazon’s management team are fueling this bullish sentiment. One such catalyst is Amazon’s recently announced stock split. On 3/9/2022, Amazon announced that its board of directors approved a 20-for-1 stock split.

AMZN March 2022
The 8-K Form filed with the SEC said: “On March 9, 2022, the Board of Directors of Amazon.com, Inc. (the “Company”) approved a 20-for-1 split of the Company’s common stock to be effected through an amendment to the Company’s Restated Certificate of Incorporation (the “Amendment”). The Amendment will also effect a proportionate increase in the number of shares of authorized common stock. The stock split and the proportionate authorized share increase are subject to shareholder approval of the Amendment at the 2022 Annual Meeting of Shareholders (the “Annual Meeting”), which is currently scheduled to take place on May 25, 2022. The Company’s definitive proxy statement relating to the Annual Meeting will include additional details regarding the Amendment.
Subject to shareholder approval of the Amendment, each Company shareholder of record at the close of business on May 27, 2022 will have 19 additional shares for every one share held as of such date reflected in their accounts on or about June 3, 2022. Trading is expected to begin on a split-adjusted basis on June 6, 2022.”
Technically, this stock split hasn’t been officially approved by shareholders yet, but due to recent bullish activity surrounding other tech stocks that have split their shares recently (such as Apple (AAPL), Tesla (TSLA), and Nvidia (NVDA)) it’s widely expected that this measure will receive strong shareholder approval.
Adria Cimino, a Nobias 5-star rated author, recently published an article at The Motley Fool titled, “3 Unstoppable Stock Split Stocks to Buy Right Now” highlighting the potential benefits of this move. Cimino described what a stock split is, and why companies do them, saying, “The company lowers the price of each individual share -- but offers current investors more shares. The company's market value and the total value of each investor's holding remains exactly the same. And the movement opens up the investment door to a broader range of individuals. It's a win-win situation. Why buy companies that have done or plan a stock split? Because the need for a split usually means business has been booming.”
Amazon’s high share price has been a limiting factor for certain investors for years. This 20-for-1 split should address this. Cimino said, “Investors have been dreaming about an Amazon stock split for quite some time. The shares have soared 5,700% since their last such operation back in 1999. And last year, they reached a record high of more than $3,600.” But, Cimino isn’t just bullish on AMZN shares because of the split alone.
Regarding Amazon’s operations, she wrote: “The online retail business and cloud computing unit Amazon Web Services (AWS) have driven gains. But these businesses' growth is far from over. For retail, Amazon's Prime subscription service keeps customers coming back with free shipping and many other benefits. The company grew members to more than 200 million worldwide in 2020. And in the most recent quarter, Amazon added "millions" more. AWS is the leading player in the cloud computing market -- and represents more than 70% of Amazon's operating income. All of this indicates there's a lot more to come for Amazon.”
Dan Burrows, a Nobias 5-star rated author, also put a spotlight the bullish nature of Amazon’s split announcement in a recent article. In Burrow’s piece at Kiplinger, Burrow notes that the move “Puts It in Play to Join the Dow”. In his article, Burrow quoted an Amazon spokesperson who said, “"This split would give our employees more flexibility in how they manage their equity in Amazon and make the share price more accessible for people looking to invest in the company.”
Burrow makes the same point Cimino did, with regard to a lower share price driving more demand for shares, especially from retail investors. However, Burrow goes a step further, highlighting the potential for inclusion into the Dow Jones Industrial average, which would drive incrementally higher. He explains, “The S&P 500 and Nasdaq Composite determine their weights by market capitalization (stock price multiplied by number of shares outstanding.) But the Dow – created way back in 1896 – is weighted by the company’s stock price.”
Right now, Burrow notes that the highest priced stock in the DOW is United Healthcare, which trades for $519.22/share. He said that Amazon couldn’t be rationally considered for DOW inclusion with it’s current $3,200 share price because of the stock-price-weighted nature of the DOW. Simply put, Burrow says that adding Amazon to the index at its current price would turn the DOW into the “Amazon & Friends Average.” But, a split changes that. And, Burrow says, since the DOW is meant to “reflect the broader economy” it might make sense for the largest domestic e-Commerce retailer and cloud play to be included. He wrote, “True, the blue-chip barometer can't be beat for brand familiarity. It might be fitting if Amazon joined the Dow.”
With regard to the incremental demand that such a maneuver would create, Burrow said: “All that said, investors should also know that being tapped for Dow inclusion is largely symbolic. Some $13.5 trillion is indexed or benchmarked to the widely used S&P 500. That means passive funds tracking the S&P 500 must own all of its components, weighted by market value. Period. Many other sector and “smart beta” funds that track all or part of the index in some way also are forced to own some or all of the S&P 500’s components.” However, he goes on to point out the relatively small size of DOW benchmarked funds relative to Amazon’s current market cap, saying, “However, only $36.6 billion is indexed or benchmarked to the Dow. Mega-cap stock AMZN, by itself, is worth roughly 40 times all the money tracking and chasing the industrial average.”
Burrow concluded his piece saying, “What we do know about the Amazon stock split is that it should bring in loads of retail investors. That, in turn, could light a small fire under shares, at least for a while. Just be aware that volume in Amazon stock would likely also increase – and so volatility very much could too.”
Another potential catalyst for an Amazon rally is the $10 billion buyback that the company recently announced. In the March 9th SEC filing, Amazon said: “On March 9, 2022, the Board of Directors also authorized the Company to repurchase up to $10 billion of the Company’s common stock. The program allows the Company to repurchase its shares opportunistically from time to time when it believes that doing so would enhance long-term shareholder value. The repurchase authorization does not have a fixed expiration. Purchases may be effected through one or more open market transactions, privately negotiated transactions, transactions structured through investment banking institutions, or a combination of the foregoing. This stock repurchase authorization replaces the previous $5 billion stock repurchase authorization, approved by the Board of Directors in 2016, under which the Company had repurchased $2.12 billion of its shares.”
While a stock split doesn’t do anything to change Amazon’s fundamentals on a per-share basis, a stock repurchase program which reduces the company’s outstanding share count will bolster bottom-line results.
Julian Lin, a Nobias 4-star rated author, recently published an article at Seeking Alpha titled, “Amazon Stock Forecast: How Will The $10 Billion Buyback Impact Investors?”
In this report, Lin said, “AMZN has $96 billion of cash & equivalents on its balance sheet versus $48.7 billion of long term debt. It can easily afford to pay for the share repurchase program using cash on hand. In general there is only one reason why companies choose to buy back their stock and that is because they feel the stock is undervalued.”
With regard to the near-term impact on fundamentals, Lin notes that the recently announced buyback is likely to represent a minimal bullish tailwind. He said, “AMZN has a market cap of $1.6 trillion, meaning that the $10 billion program, if executed in full, represents less than 1% of shares outstanding.” However, Lin continues, “That said, this buyback potentially is very meaningful over the long term if it reflects a shift in AMZN’s capital allocation policies.”
Billy Duberstein, a Nobias 4-star rated author, also recently published an article noting the bullish prospects associated with Amazon’s buyback. In his article, titled, “Why Now May Be the Perfect Time to Buy Amazon” Duberstein highlighted why a company like Amazon might consider repurchasing shares. He wrote, “one, that management believes shares are undervalued, and two, that the company may be in for a cash windfall this year.” He continued, “Why might Amazon be in for a cash windfall? Because it's coming off of an absolutely massive investment cycle necessitated by the pandemic. After spending $16.8 billion in capital expenditures in 2019, Amazon invested $40.1 billion in capital expenditures in 2020 and a whopping $61 billion in capex in 2021.”
Nicholas Ward is a Senior Investment Analyst at Wide Moat Research. He has spent the last 8 years writing about the stock market at various publications, including Seeking Alpha, The Street, Forbes Real Estate Investor, Sure Dividend, The Dividend Kings, iREIT, Safe High Yield, and The Intelligent Dividend Investor.
With regard to capex, Duberstein said, “The company has also been buying more planes to fulfill demand without having to depend on third parties for shipping. Amazon has also more than doubled its workforce since the beginning of 2020, from 800,000 to over 1.6 million employees by the end of 2021.” Duberstein notes that these investments have come at a “huge cost” to the company and the damage that they’ve done to the company’s cash flows have likely factored into the stock’s recent underperformance. He said, “Though revenue rose 21.7% in 2021, operating income only rose 8.6%, and free cash flow went into the red, with a $15 billion cash burn last year, compared with $26 billion in free cash flow in 2020.”
But, Duberstein believes that Amazon’s record high capex is coming to an end. He said, “With the capital-intensive e-commerce business coming off a massive investment cycle, and high-margin AWS and ad revenues making up more and more of the business, Amazon's cash flow stands to inflect higher this year. That could lead investors to warm to the stock again.”
Duberstein concluded his piece saying, “Based on history, it's generally been good policy to follow management's lead; shares are up over 1,400% since the last stock repurchase, even after the recent sell-off.“
Disclosure: Of the stocks mentioned in this article, Nicholas Ward is long AMZN, AAPL, and NVDA. Nicholas Ward wrote this article for Nobias at their request with a view of giving investors a balanced perspective based on the writings of Nobias highly rated analysts and bloggers. Nobias has no business relationship with any company whose stock is mentioned in this article and does not have a position in this stock.
Additional disclosure: All content is published and provided as an information source for investors capable of making their own investment decisions. None of the information offered should be construed to be advice or a recommendation that any particular security, portfolio of securities, transaction, or investment strategy is suitable for any specific person. The information offered is impersonal and not tailored to the investment needs of any specific person.
Disclaimer: The Nobias star rating is based on past performance results and is not an indicator of future results. These past performance returns do not represent returns that any investor actually earned. Assumptions made include the ability to purchase the stocks recommended by the author under liquid markets where the transaction would be at the market price for the day. In reality, loss in liquidity may have a material impact on the returns that actually may have been earned. Further, returns are calculated without any including transaction costs, management fees, performance fees or expenses, or reinvestment of dividends and other income. This information is provided for illustrative purposes only.
DG with Nobias Technology: Dollar General Raises Dividend by 31% as 2022 Guidance Points to Growth? (Copy)
Dollar General (DG) shares have suffered on a year-to-date basis, posting -6.26% results thus far during 2022. However, the stock is up 19.2% from the 52-week lows that it made in late February. The company recently posted Q4 results, which included double digit growth estimates for fiscal 2022. Dollar General also recently provided investors with a double digit dividend increase. Historically, the dollar store industry has provided market beating results during bear markets. And therefore, with rates on the rise and the threat of recession rising along with them, it appears that investors are becoming more and more interested in these potentially defensive shares.
Dollar General (DG) shares have suffered on a year-to-date basis, posting -6.26% results thus far during 2022. However, the stock is up 19.2% from the 52-week lows that it made in late February. The company recently posted Q4 results, which included double digit growth estimates for fiscal 2022. Dollar General also recently provided investors with a double digit dividend increase. Historically, the dollar store industry has provided market beating results during bear markets. And therefore, with rates on the rise and the threat of recession rising along with them, it appears that investors are becoming more and more interested in these potentially defensive shares.
Nobias 5-star rated author, Kim Johansen, published an article on Dollar General at The Markets Daily recently, breaking down the company’s fundamentals as well as news of increased shareholder returns. Regarding the stock’s recent performance, Johansen wrote: “Shares of DG stock opened at $229.63 on Friday. Dollar General Co. has a 12-month low of $178.66 and a 12-month high of $240.14. The company has a current ratio of 1.08, a quick ratio of 0.15 and a debt-to-equity ratio of 0.67. The firm’s 50 day moving average is $207.63 and its 200 day moving average is $216.64. The stock has a market capitalization of $53.21 billion, a P/E ratio of 22.49, a P/E/G ratio of 1.57 and a beta of 0.58.”
Johansen continued, saying, “Dollar General announced that its Board of Directors has initiated a stock buyback program on Thursday, December 2nd that authorizes the company to repurchase $2.00 billion in outstanding shares. This repurchase authorization authorizes the company to buy up to 3.9% of its stock through open market purchases. Stock repurchase programs are typically a sign that the company’s management believes its stock is undervalued.”

DG March 2022
Keith Speights, a Nobias 4-star rated author, recently published a report titled, “3 Stocks to Buy Now If You're Anxious About the Stock Market” which put a spotlight on Dollar General as a potentially low-risk play for nervous investors to consider. Speights touched upon the fact that rising rates have the potential to create a recession in the United States. And historically, Dollar General is the type of stock that has posted outperformance during bear markets due to its focus on value and low prices for consumers whose checkbooks may be hurting. For instance, during 2020, Dollar General saw its earnings-per-share rise by 13% (during a period of time where many of its retail peers struggled due to COVID-19 social distancing restrictions). However, as Speights points out in his piece, DG shares have also performed well throughout bull markets as well.
Regarding bull markets he said, “But what about during economic booms? Dollar General's shares trounced the S&P 500 during the 10-year period ending Dec. 31, 2021, soaring 669%. The key to that impressive gain was the retailer's strategy of adding more stores.”
Speights continued, noting that DG continues to expand its footprint, setting itself up for more sales and earnings growth ahead. He said, “Dollar General plans to add 1,100 new stores and triple the number of its suburbs-focused pOpshelf stores in fiscal year 2022. Unsurprisingly, the consensus Wall Street price target for the stock reflects a 17% premium to Dollar General's current share price.”
On March 17th, Dollar General posted its fourth quarter earnings. The company missed Wall Street estimates on both the top and bottom lines; however, the stock is still holding up relatively well. DG shares have risen by 16.02% during the past month. Although Q4 results were disappointing, it appears that forward looking guidance has appeased Wall Street.
During Q4, DG posted revenue of $8.65 billion, which missed analyst estimates by $60 million and represented 2.9% year-over-year growth. Dollar General’s Q4 non-GAAP earnings-per-share came in at $2.57, missing consensus estimates by $0.01/share.
Dollar general’s same-store-sales suffered in 2021 overall, falling 2.8% on the year. However, management noted that on a 2-year trailing basis, same-store-sales growth is 13.5%, showing that the company was up against very strong comparisons due to the company’s positive sales growth performance during 2020.
The same story was in place when it came to earning-per-share. DG’s Q4 report said, “Fiscal Year Diluted EPS Decreased 4.2% to $10.17, resulting in a two-year compound annual growth rate of 23.8%, or 22.9% compared to 2019 Adjusted Diluted EPS”.
During the Q4 report Todd Vasos, Dollar General’s chief executive officer, said: “For the full year, we are pleased with our net sales increase of 1.4%, which was on the high end of our guidance, and on top of a robust 21.6% increase in fiscal 2020. In addition, during the year, we completed the initial rollout of DG Fresh, executed more than 2,900 real estate projects, including the opening of our 18,000th store and 50 standalone pOpshelf locations, and launched new initiatives focused on health and international expansion.”
He continued, saying, “Overall, we are excited about our plans for 2022, as we look to further differentiate Dollar General from the rest of the retail landscape, while delivering long-term sustainable growth and value for our shareholders.”
Nicholas Ward is a Senior Investment Analyst at Wide Moat Research. He has spent the last 8 years writing about the stock market at various publications, including Seeking Alpha, The Street, Forbes Real Estate Investor, Sure Dividend, The Dividend Kings, iREIT, Safe High Yield, and The Intelligent Dividend Investor.
DG provided 2022 guidance, saying: “Despite this uncertainty, the Company is providing financial guidance for the 53-week fiscal year ending February 3, 2023 (“fiscal year 2022”), in which the Company currently expects:
Net sales growth of approximately 10%, including an estimated benefit of approximately two percentage points from the 53rd week
Same-store sales growth of approximately 2.5%
Diluted EPS growth in the range of approximately 12% to 14%, including an estimated benefit of approximately four percentage points from the 53rd week. This Diluted EPS guidance assumes an effective tax rate in the range of 22.5% to 23.0%
Share repurchases of approximately $2.75 billion
Capital expenditures, including those related to investments in the Company’s strategic initiatives, in the range of $1.4 billion to $1.5 billion”
Also, during the Q4 report, DG made headlines raising its dividend by 31%. The company increased its quarterly dividend from $0.42/share to $0.55/share. It appears that the credible authors and analysts that the Nobias algorithm tracks have also been pleased with the company’s recent operational performance. Looking at recent articles published by credible Nobias authors (individuals with 4 and 5-star ratings), we see that 90% of opinions expressed about DG stock have been “Bullish”.
The average price target currently being applied to DG shares by the credible Wall Street analyst that our algorithm tracks (once again, only those with 4 and 5-star Nobias ratings) is $249.50. Today, DG shares trade for $220.47, meaning that this price target represents upside potential of approximately 13.2%.
Disclosure: Nicholas Ward has no DG position. Nicholas Ward wrote this article for Nobias at their request with a view of giving investors a balanced perspective based on the writings of Nobias highly rated analysts and bloggers. Nobias has no business relationship with any company whose stock is mentioned in this article and does not have a position in this stock.
Additional disclosure: All content is published and provided as an information source for investors capable of making their own investment decisions. None of the information offered should be construed to be advice or a recommendation that any particular security, portfolio of securities, transaction, or investment strategy is suitable for any specific person. The information offered is impersonal and not tailored to the investment needs of any specific person.
Disclaimer: The Nobias star rating is based on past performance results and is not an indicator of future results. These past performance returns do not represent returns that any investor actually earned. Assumptions made include the ability to purchase the stocks recommended by the author under liquid markets where the transaction would be at the market price for the day. In reality, loss in liquidity may have a material impact on the returns that actually may have been earned. Further, returns are calculated without any including transaction costs, management fees, performance fees or expenses, or reinvestment of dividends and other income. This information is provided for illustrative purposes only.
ADBE with Nobias Technology: Adobe shares drop nearly 39.5% from their 52-week highs
For years, Adobe was one of the hottest stocks on Wall Street. During the last 10 years, ADBE shares are up 1,121.20%. If it wasn’t for the stock’s recent precipitous declines, these trailing results would look immensely stronger. Adobe’s 52-week high is $699.54, set in late 2021. Today, shares trade for $422.90, down approximately 39.5% from those highs. And, yesterday, the stock fell 9.34% on disappointing first quarter results. However, Adobe’s results last year still represented a strong growth trajectory.
For years, Adobe was one of the hottest stocks on Wall Street. During the last 10 years, ADBE shares are up 1,121.20%. And, if it wasn’t for the stock’s recent precipitous declines, these trailing results would look immensely stronger.
Adobe’s 52-week high is $699.54, set in late 2021. Today, shares trade for $422.90, down approximately 39.5% from those highs. ADBE shares are down 25.07% on a year-to-date basis. And, just yesterday, the stock fell 9.34% (throughout much of the trading session, shares were down 10%+) on disappointing first quarter results.
There is little doubt that this former market darling has lost a lot of its luster. However, the stock continues to post strong operational growth. And, when looking at the analysis performed by the credible authors and Wall Street analysts that the Nobias algorithm tracks, it appears that the stock’s recent sell-off has been overdone.
Although the stock has suffered throughout 2022, Adobe’s results last year still represented a strong growth trajectory. Julian Lin, a Nobias 4-star rated author, recently published a bullish article on ADBE shares which highlights its fiscal 2021 results.
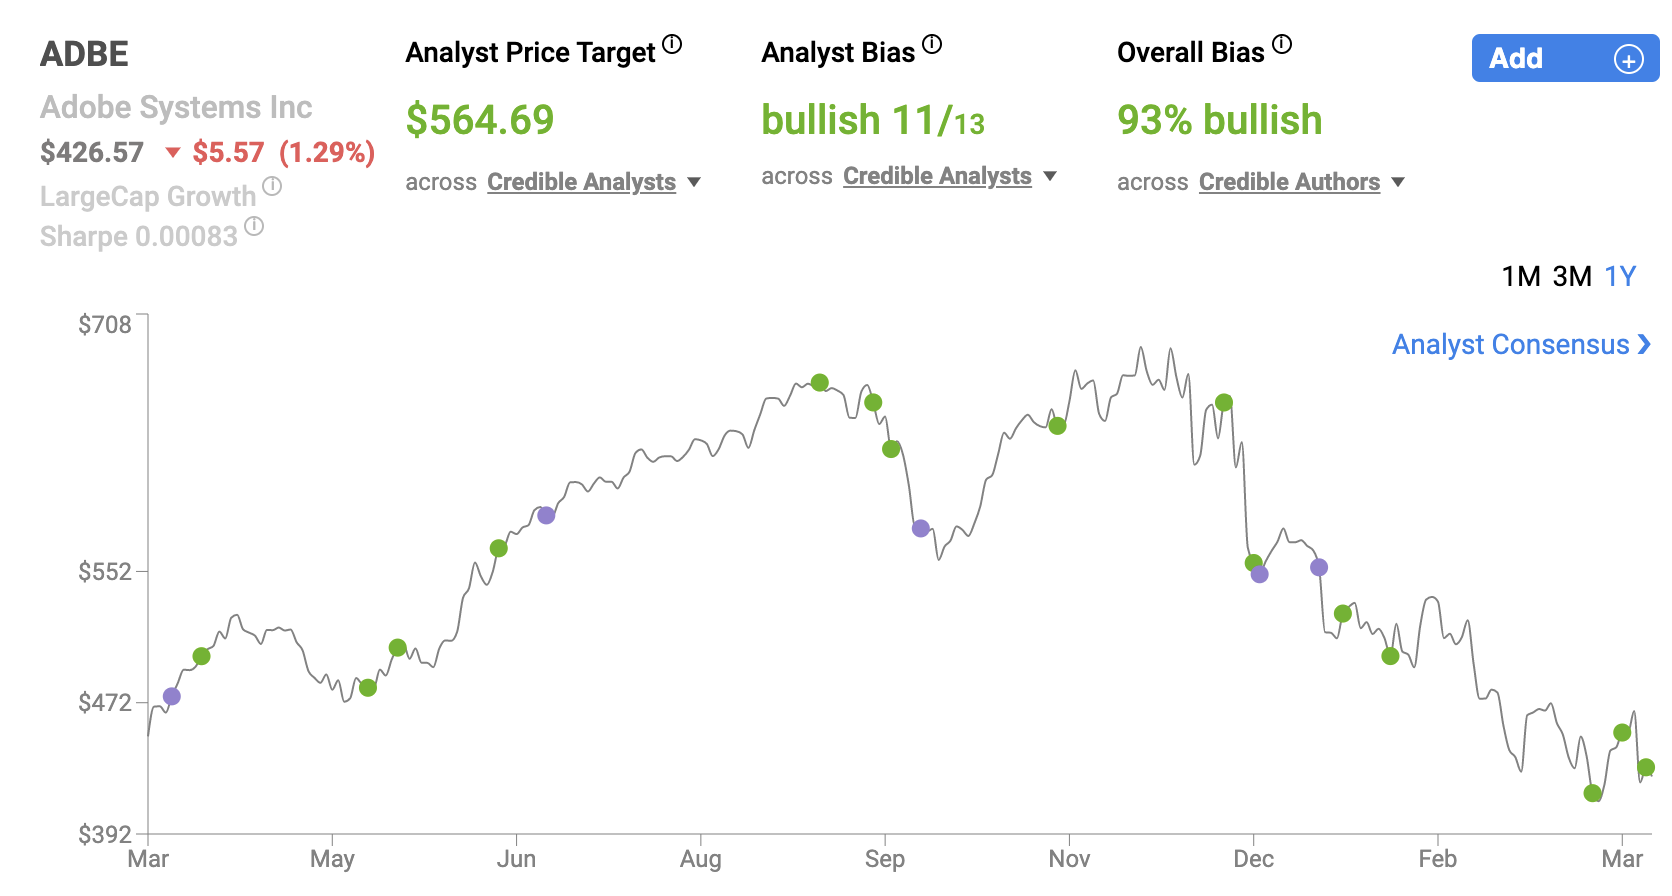
ADBE March 2022
Lin said, “ADBE closed out its FY21 with strong results. It beat on all of its original targets, delivering $15.8 billion in revenue and $12.48 in non-GAAP earnings per share.” He continued, “Those results reflected 22.7% and 23.6% growth, respectively. The strong results were fueled in large part due to the 29% revenue growth at its Document Cloud division, powered by its move into the e-signature market. ADBE also generated robust growth at Creative Cloud (includes the Photoshop software) and Experience Cloud (online marketing and web analytics products).”
Lin touched upon Adobe’s balance sheet saying, “ADBE maintains a strong balance sheet with $1.7 billion in net cash. The $4.1 billion in debt suggests that ADBE management is willing to eventually lever up the company to boost shareholder returns.” And, he highlighted the company’s year-end fiscal 2022 guidance saying, “ADBE has guided for the next fiscal year to see revenue grow 13.3% and for earnings per share to grow 9.8%.”
Lin noted that in a pessimistic scenario, the stock could generate annual returns of 13%-15% moving forward (based upon earnings growth projections). He concluded his report saying, “I rate shares a buy as part of a lower-risk tech allocation, as the share repurchase program may help the stock be among the earliest to rally in any tech recovery.”
Lin isn’t the only credible author that we track who has recently published a bullish report on ADBE shares. Nobias 5-star rated author, Daniel Foelber, recently wrote an article titled, “1 Growth Stock, 1 Value Stock, and 1 Cryptocurrency to Buy for 2022” and Adobe was the growth stock that he put a spotlight on. Foelber said, “The best growth stocks aren't the fastest growers, but, rather, are the companies that have industry-leading positions in exciting marketplaces, offer strong profit, and generate consistent positive free cash flow. If the last few years have taught us anything, it's that the market favors this balanced level of growth at a reasonable price over growth at all costs. And few companies do it better than Adobe.” He continued, “A few decades ago, discussions of recession resilience were usually reserved for consumer staple companies like Procter & Gamble that make products people need no matter how the economy is doing. Today, one could argue that companies like Adobe are digital staples, or enterprise staples because their solutions are needed to conduct business. Given its massive moat, improved profitability, and the fact that it's down 26% from its 52-week high, Adobe stands out as a solid all-around growth stock to buy in 2022 and hold forever.”
Obviously Adobe’s sell-off has accelerated since Foelber published that piece, with shares currently down roughly 40% from 52-week highs. And yet, looking at the company’s recent quarterly results (which sparked yesterday’s 10% sell-off), it’s clear that this company remains on a very reliable growth runway.
When Adobe reported its first quarter earnings, the company beat Wall Street consensus estimates on both the top and bottom lines. ABDE’s Q1 revenue totaled $4.26 billion, which was $20 million above expectations and represented 9.0% year-over-year growth. On an adjusted basis, this $4.26 billion revenue figure represented 17% year-over-year growth. ADBE’s Q2 non-GAAP earnings-per-share came in at $3.37, beating Wall Street’s estimate by $0.03/share.
During the company’s first quarter report, Adobe’s CEO, Shantanu Narayen, was quoted saying, “Adobe achieved record Q1 revenue as Creative Cloud, Document Cloud and Experience Cloud continue to be pivotal in driving the digital economy. Adobe is committed to empowering individuals, transforming businesses and connecting communities.”
The company’s CFO, Dan Durn, said, “Adobe’s Q1 results reflect the company’s strong execution and resilience through unprecedented circumstances. Our momentum, product innovation and immense market opportunity position us for success in 2022 and beyond.”
Nicholas Ward is a Senior Investment Analyst at Wide Moat Research. He has spent the last 8 years writing about the stock market at various publications, including Seeking Alpha, The Street, Forbes Real Estate Investor, Sure Dividend, The Dividend Kings, iREIT, Safe High Yield, and The Intelligent Dividend Investor.
Adobe’s Q1 report shows that each of the company’s primary operating segments posted double digit y/y growth on an adjusted basis. The company said: “Digital Media segment revenue was $3.11 billion, which represents 9 percent year-over-year growth or 17 percent adjusted year-over-year growth1. Creative revenue grew to $2.55 billion, representing 7 percent year-over-year growth or 16 percent adjusted year-over-year growth1. Document Cloud revenue was $562 million, representing 17 percent year-over-year growth or 26 percent adjusted year-over-year growth1.”
During Q1, Adobe’s cash flows from operations totaled $1.8 billion. The company took advantage of recent share price weakness, using its cash flows, as well as the cash on its balance sheet, to repurchase approximately 3.8 million shares, worth $2.1 billion, showing that ADBE management and its Board of Directors appear to believe that shares are cheap at current valuations. It appears that this level of growth disappointed Wall Street (otherwise, we wouldn’t have seen such a drastic sell-off after the Q1 results were posted); however, when looking at the sentiment expressed by the credible authors and analysts that we track with the Nobias algorithm, there is a very strong bullish bias surrounding shares.
93% of the opinions recently expressed by credible (4 and 5-star rated) authors have been “Bullish”. And, when looking at the credible Wall Street analysts that our algorithm tracks (once again, only those with 4 and 5-star Nobias ratings) we see that the average price target being applied to ADBE shares is currently $581.09. After ADBE’s nearly 10% sell-off its shares are trading for $422.90. Relative to that $581.09 price target, today’s share price represents upside potential of approximately 37.4%.
Disclosure: Nicholas Ward is long ADBE. Nicholas Ward wrote this article for Nobias at their request with a view of giving investors a balanced perspective based on the writings of Nobias highly rated analysts and bloggers. Nobias has no business relationship with any company whose stock is mentioned in this article and does not have a position in this stock.
Additional disclosure: All content is published and provided as an information source for investors capable of making their own investment decisions. None of the information offered should be construed to be advice or a recommendation that any particular security, portfolio of securities, transaction, or investment strategy is suitable for any specific person. The information offered is impersonal and not tailored to the investment needs of any specific person.
Disclaimer: The Nobias star rating is based on past performance results and is not an indicator of future results. These past performance returns do not represent returns that any investor actually earned. Assumptions made include the ability to purchase the stocks recommended by the author under liquid markets where the transaction would be at the market price for the day. In reality, loss in liquidity may have a material impact on the returns that actually may have been earned. Further, returns are calculated without any including transaction costs, management fees, performance fees or expenses, or reinvestment of dividends and other income. This information is provided for illustrative purposes only.
BABA with Nobias technology: Up 35% Alibaba is still a Stock with Significant Upside
After months of selling pressure, largely due to regulatory issues, the Chinese tech sector saw a major rebound this week. The KraneShares CSI China Internet ETF (KWEB) has now rallied 43.19% during the last 5 trading sessions alone. It’s important to note that even after this massive rally, the KWEB is still down 14.66% on a year-to-date basis. During the trailing twelve months, the KWEB index is down 63%. Evelyn Chang published an article at CNBC this week highlighting the inspiration for last week’s rally.
After months of selling pressure, largely due to regulatory issues, the Chinese tech sector saw a major rebound this week. The KraneShares CSI China Internet ETF (KWEB) has now rallied 43.19% during the last 5 trading sessions alone. It’s important to note that even after this massive rally, the KWEB is still down 14.66% on a year-to-date basis. During the trailing twelve months, the KWEB index is down 63%. Evelyn Chang published an article at CNBC this week highlighting the inspiration for last week’s rally.
Chang noted that China “signaled support” for its equity space this week, saying, “Chinese and U.S. regulators are progressing toward a cooperation plan on U.S.-listed Chinese stocks, state media said, citing a financial stability meeting Wednesday chaired by Vice Premier Liu He.” She continued, “Liu also heads the central government’s finance committee and is a member of the Chinese Communist Party’s central committee politburo — the country’s second-highest circle of power.”
CNBC translated the report published by Chinese state media, which read, “The Chinese government continues to support various kinds of businesses’ overseas listings.” Furthermore, Change said, “The article said regulators should “complete as soon as possible” the crackdown on internet platform companies.”
On Friday, the rally in the Chinese equity space continued. A report from Bloomberg News noted that the latest leg of the rally was based upon speculation that Chinese regulators may ease monetary and COVID-19 policies as well.

BABA March 2022
The Bloomberg article said, “Expectations that the People’s Bank of China would take more steps in the near term to spur the economy led to the recovery in the afternoon session, according to traders.” It continued, “One tool could include cutting banks’ reserve requirements, they said.”
Lastly, the article notes, “Investors are also turning more hopeful that China will make adjustments to its Covid restrictions. Xi has pledged to reduce the economic impact of his Covid-fighting measures, signaling a shift in a longstanding strategy that has minimized fatalities but weighed heavily on the world’s second-largest economy.”
With the potential threat of delisting from U.S equity exchanges and some of the uncertainty associated with regulatory pressures lifted from the space, investors flocked back into many popular Chinese stocks. Alibaba (BABA) shares rose 35.48% last week, pushing its market cap up to $269.7 billion.
Prior to BABA’s recent rally, Nobias 5-star rated author, Micah Haroldson, published an article on Alibaba in which he highlighted the company’s fundamentals. Haroldson said, “Alibaba Group stock opened at $86.71 on Friday. The company has a market cap of $235.06 billion, a price-to-earnings ratio of 23.25, a PEG ratio of 1.71 and a beta of 0.88. The firm’s fifty day moving average is $118.08 and its 200 day moving average is $138.82. The company has a quick ratio of 1.64, a current ratio of 1.64 and a debt-to-equity ratio of 0.12. Alibaba Group Holding Limited has a 52-week low of $86.68 and a 52-week high of $245.69.”
If the regulatory headwinds are removed from the Alibaba narrative, the stock can get back to trading on fundamentals. Coming into BABA’s recent earnings report, Nobias 5-star rated author, The Asian Investor, published an article on Alibaba at Seeking Alpha showing their bullish outlook on the company’s growth potential.
The Asian Investor said, “For the December quarter, the expectation is for Alibaba to have earnings of $2.55 per share (implying a 25.3% year over year decrease) and revenues of $38.8B. For the full-year, Alibaba is expected to generate 20-23% revenue growth, as per company guidance, which would result in total FY 2022 revenues of $135.9B. I believe Alibaba may even be able to outperform its own guidance based on accelerating e-commerce momentum.”
With regard to the recent news surrounding a softer regulatory stance by the CCP, the Asian Investor showed great foresight in their February 4th article, saying,“I believe the risk analysis has changed quite a bit in recent months and political risks have decreased. Regulators now appear to take a softer stance on overseas stock listings which implies improving commercial growth prospects for Alibaba's core business. Macro risks are still present and Alibaba is subjected to political risks, but I believe an ADR delisting is now highly unlikely.”
Ultimately, looking ahead to BABA’s fiscal Q3 results, The Asian Investor concluded, “As Beijing pulls back from cracking down on its leading technology and e-commerce companies, there is an opportunity for a major re-pricing of Alibaba's free cash flow growth prospects.”
Dante Gardner, a Nobias 5-star rated author, broke down BABA’s fiscal Q3 results in a report published at The Lincolnian Online, saying: “The specialty retailer reported $16.87 EPS for the quarter, topping the consensus estimate of $1.92 by $14.95. The business had revenue of $242.58 billion for the quarter, compared to the consensus estimate of $245.79 billion. Alibaba Group had a return on equity of 10.84% and a net margin of 7.86%. Alibaba Group’s revenue was up 9.7% compared to the same quarter last year. During the same period in the previous year, the business earned $2.98 EPS. Sell-side analysts forecast that Alibaba Group Holding Limited will post 6.06 EPS for the current year.”
Growth At A Good Price, a Nobias 5-star rated author, touched upon these earnings results in a recent Seeking Alpha article as well, noting that while BABA’s earnings growth was negative on a year-over-year basis, much of the bearish pressure on the stock was related to one-time items.
Growth At A Good Price said, “First of all, the GAAP earnings and operating income were impacted by unrealized stock market losses and impairment charges. Those together took a $5 billion bite out of earnings.” They concluded their article saying, “The bottom line on Alibaba's Q3 earnings is that they highlighted what we always knew about the company. Namely, that it is a fundamentally strong entity with solid profitability and revenue growth, that has the ability to grow more from this point onward. Yes, higher taxes and increased competitive pressure will eat into the growth somewhat. But none of these factors are fatal to Alibaba's core business, which will start to thrive as it laps the weak 2021 quarters later this year.”
Billy Duberstein, a Nobias 4-star rated author, published an article in late 2021 at Motley Fool showing that while Alibaba appeared to be cheap, there is still a strong speculative growth element associated with this company. Duberstein said, “However, outside of Alibaba's core business, basically no other new Alibaba business -- whether acquired or organically built -- is currently profitable. Many investors have faith that these growing new commerce businesses in grocery, delivery logistics, digital entertainment, and other areas will eventually be profit contributors. Although I do think Alibaba's cloud will eventually become nicely profitable, all the other businesses are in very competitive fields and are no sure thing.”
Nicholas Ward is a Senior Investment Analyst at Wide Moat Research. He has spent the last 8 years writing about the stock market at various publications, including Seeking Alpha, The Street, Forbes Real Estate Investor, Sure Dividend, The Dividend Kings, iREIT, Safe High Yield, and The Intelligent Dividend Investor.
More recently, in a separate Motley Fool article, Duberstein acknowledged all of the risks associated with BABA shares, saying, “Remember when buying Chinese stocks, wherever they're listed, that the Chinese government can giveth, but can also taketh away.”
However, he concluded, “So for those who understand the risks, Chinese stocks in general may look like good values heading into 2022 after underperforming last year. Alibaba is certainly a candidate to outperform, but really the whole Chinese tech sector is much cheaper than it used to be. If you have a favorite -- whether it's Alibaba or another name -- now may be the time to go shopping.”
Overall, when looking at the credible authors that the Nobias algorithm tracks (only those with 4 and 5-star ratings), we see a strong bullish lean when it comes to Alibaba shares. 81% of reports published by credible authors covering BABA have expressed “Bullish” sentiment. And, even after the stock’s 35% rally this week, the credible Wall Street analysts that the Nobias algorithm tracks also continue to be bullish on BABA shares.
Right now, the average price target being applied to BABA by the credible analysts that we track is $181.67. Compared to BABA’s current share price of $117.24, that average price target represents upside potential of over 60%.
Disclosure: Nicholas Ward has no BABA position. Nicholas Ward wrote this article for Nobias at their request with a view of giving investors a balanced perspective based on the writings of Nobias highly rated analysts and bloggers. Nobias has no business relationship with any company whose stock is mentioned in this article and does not have a position in this stock.
Additional disclosure: All content is published and provided as an information source for investors capable of making their own investment decisions. None of the information offered should be construed to be advice or a recommendation that any particular security, portfolio of securities, transaction, or investment strategy is suitable for any specific person. The information offered is impersonal and not tailored to the investment needs of any specific person.
Disclaimer: The Nobias star rating is based on past performance results and is not an indicator of future results. These past performance returns do not represent returns that any investor actually earned. Assumptions made include the ability to purchase the stocks recommended by the author under liquid markets where the transaction would be at the market price for the day. In reality, loss in liquidity may have a material impact on the returns that actually may have been earned. Further, returns are calculated without any including transaction costs, management fees, performance fees or expenses, or reinvestment of dividends and other income. This information is provided for illustrative purposes only.
UPST with Nobias technology: Upstart Holdings: A Rollercoaster Ride Unlikely To End Anytime Soon
Like so many of the more speculative growth stocks from the tech sector, Upstart Holdings (UPST) has experienced quite a bit of volatility throughout 2022 thus far. The stock began the year trading for approximately $145/share. Then, Upstart was sold off, alongside so many other of the high growth tech stocks, falling down to the $90 area during late January/early February. Then, in mid-February, the company posted a strong earnings report, beating analyst consensus estimates on both the top and bottom lines, causing shares to rally back into positive year-to-date territory, with shares peaking in the $157 area in early March.
Like so many of the more speculative growth stocks from the tech sector, Upstart Holdings (UPST) has experienced quite a bit of volatility throughout 2022 thus far. The stock began the year trading for approximately $145/share. Then, Upstart was sold off, alongside so many other of the high growth tech stocks, falling down to the $90 area during late January/early February. Then, in mid-February, the company posted a strong earnings report, beating analyst consensus estimates on both the top and bottom lines, causing shares to rally back into positive year-to-date territory, with shares peaking in the $157 area in early March.
However, in recent weeks, we’ve seen negative sentiment drive shares back towards their 2022 lows and right now, UPST trades for $106.95, meaning that shares are down 26.07% on a year-to-date basis. What’s more, at $106.95, UPST is down an astounding 73.4% from its current 52-week high of $401.49 that the stock made in the middle of last year.
Therefore, after this roller coaster of a ride that shareholders have been on recently, we decided that it was time to take a look at what the credible authors and analysts have had to say about Upstart Holdings to see if this 70%+ drop is a dip worth buying. Last week, Nobias 5-star rated author, Wayne Rhoads, published an article at zolmax.com which highlighted the company’s operating profile and recent insider trading activity.

UPST March 2022
Rhoads described Upstart Holdings as “a cloud- based artificial intelligence (AI) lending platform. The company's platform aggregates consumer demand for loans and connects it to its network of the company's AI- enabled bank partners. Its platform connects consumers, banks, and institutional investors through a shared AI lending platform.”
Regarding insider sales, he said, “CEO Dave Girouard sold 83,333 shares of the company’s stock in a transaction dated Tuesday, February 1st. The shares were sold at an average price of $109.37, for a total transaction of $9,114,130.21. The transaction was disclosed in a filing with the Securities & Exchange Commission, which is accessible through the SEC website.”
Rhoads continued, noting that, “Also, General Counsel Alison Nicoll sold 7,500 shares of the company’s stock in a transaction dated Wednesday, March 2nd. The stock was sold at an average price of $146.64, for a total transaction of $1,099,800.00. The disclosure for this sale can be found here.” Lastly, he said, “In the last 90 days, insiders have sold 249,374 shares of company stock valued at $32,085,708. Insiders own 25.20% of the company’s stock.”
These insider sales have likely played a role in the negative sentiment surrounding UPST shares at the moment; while it’s true that insiders sell for various reasons and they don’t also signal trouble from an operating point of view, this level of insider selling doesn’t bode well for the market’s confidence in a given stock. And, that’s too bad (for the bulls here) because it wasn’t long ago that it appeared that some of the storm clouds following UPST around had abated.
On February 17th, Bram Berkowitz, a Nobias 4-star rated author, published an article at The Motley Fool titled, “Why Shares of Upstart Are Surging This Week”. In his piece, Berkowitz said, “Shares of the artificial intelligence (AI) lender Upstart ( UPST 9.71% ) had surged nearly 40% this week as of market close Thursday after the company reported superb earnings results for the fourth quarter of 2021.” He continued, “Upstart reported adjusted earnings per share of $0.89 on total revenue of $305 million, easily beating analyst estimates. The company originated nearly $4.1 billion of loans in the quarter, a nearly $1 billion increase from the prior quarter. In tandem with earnings, Upstart also announced a $400 million share repurchase program.”
Berkowitz wasn’t the only one who thought that Upstart’s results were stellar. During the company’s Q4 earnings release, Upstart’s Co-Founder and CEO, Dave Girouard, said, “With triple-digit growth and record profits, Q4 was an exceptional finish to a breakout year for Upstart. 2021 will be remembered as the year AI lending came to the forefront, kicking off the most impactful transformation of credit in decades.”
Girouard continued, "But AI lending isn’t a one-category phenomenon. I’m also happy to report that, with help from an epic push by our team in the last few weeks of the year, auto loan originations on our platform are now ramping quickly and will provide growth opportunities to Upstart for years to come."
Furthermore, during its Q4 report, UPST provided guidance for the market, highlighting its full-year 2022 goals. The company stated: For the full year 2022, Upstart expects:
Revenue of approximately $1.4 billion
Contribution Margin of approximately 45%
Adjusted EBITDA of approximately 17%
Auto Transaction Volume of approximately $1.5 billion
Relative to full-year 2021’s revenue result of $849 million, this represents top-line growth potential of approximately 65%. That was certainly the type of guidance that the market wanted to see (as shown by the ~40% rally that Berkowitz highlighted). Berkowitz concludes his article with an air of cation, saying, “While Upstart did have a strong fourth quarter, I do have some concerns about the company as we head into a much different monetary environment and one where credit quality might not be so benign, as the Federal Reserve increases its benchmark overnight lending rate.”
As it turns out, Berkowitz wasn’t the only credible author that we follow that has expressed a somewhat neutral opinion on the company in a post-Q4 earnings result world. The Value Pendulum, a Nobias 4-star rated author, recently published a report on UPST at Seeking Alpha which broke down the company’s recent results, highlighting both the pros and cons of the company’s shares from a fundamental perspective.
Ultimately, The Value Pendulum came to the conclusion that: “UPST stock is a Hold. A comparison of Upstart's forward Enterprise Value-to-Revenue valuations with that of its peers suggests that the stock is fairly valued now. On the positive side of things, UPST's automotive refinancing has good growth prospects as evidenced by the company's 2022 revenue guidance. On the negative side of things, it might be difficult for Upstart's valuation multiples to expand substantially in the short term, as the fintech sector is out of favor now and there are worries about the increase in the company's default rates.”
With regard to the tough macro environment that names like UPST find themselves operating in at the moment, we recently saw another Nobias 4-star rated author, Billy Duberstein, post a report on the company, putting a spotlight on the recent pullback that the fin-tech industry has experienced.
In his March 14th article at The Motley Fool, Duberstein said, “Fintechs benefited over the past few years as the interest rate environment was amenable to high-growth technology stocks, and the economy was relatively healthy. However, the current environment is causing concerns that both those trends might reverse.” He continued, touching upon the Federal Reserve’s recent decision to raise rates, saying:
Nicholas Ward is a Senior Investment Analyst at Wide Moat Research. He has spent the last 8 years writing about the stock market at various publications, including Seeking Alpha, The Street, Forbes Real Estate Investor, Sure Dividend, The Dividend Kings, iREIT, Safe High Yield, and The Intelligent Dividend Investor.
“What may have really driven these stocks lower today is the 10-year Treasury Bond yield rocketing 6.8% higher to 2.14%, the highest reading since 2019, and now even higher than in the months prior to the pandemic. That could signal that inflation metrics are becoming more embedded. High inflation tends to lead to higher interest rates, which decrease the value of earnings far out into the future.
That hurts the value of growth stocks like Upstart, Block, and Lemonade. Upstart trades at 62 times earnings, Block trades at 287 times earnings, and Lemonade is still unprofitable. Therefore, it's no surprise they got hurt along with other high-growth tech stocks today.”
Overall, when looking at the credible authors that the Nobias algorithm tracks, the sentiment surrounding Upstart Holdings is Neutral, with 52% of recent reports expressing a “Bullish” outlook. However, the credible analysts that we follow are much more bullish. The average price target that the credible Wall Street analysts that we track apply to UPST is currently $214.50.
Relative to the stock’s current share price of $106.95, that represents upside potential of approximately 100.5%. Therefore, it’s clear to see why the stock has been so volatile recently. There is a mighty game of tug-of-war being played right now between the bulls and the bears and this speculative growth stock is caught up in the middle of it.
Disclosure: Of the stocks mentioned in this article, Nicholas Ward has a long position in SQ. Nicholas Ward wrote this article for Nobias at their request with a view of giving investors a balanced perspective based on the writings of Nobias highly rated analysts and bloggers. Nobias has no business relationship with any company whose stock is mentioned in this article and does not have a position in this stock.
Additional disclosure: All content is published and provided as an information source for investors capable of making their own investment decisions. None of the information offered should be construed to be advice or a recommendation that any particular security, portfolio of securities, transaction, or investment strategy is suitable for any specific person. The information offered is impersonal and not tailored to the investment needs of any specific person.
Disclaimer: The Nobias star rating is based on past performance results and is not an indicator of future results. These past performance returns do not represent returns that any investor actually earned. Assumptions made include the ability to purchase the stocks recommended by the author under liquid markets where the transaction would be at the market price for the day. In reality, loss in liquidity may have a material impact on the returns that actually may have been earned. Further, returns are calculated without any including transaction costs, management fees, performance fees or expenses, or reinvestment of dividends and other income. This information is provided for illustrative purposes only.
CRWD with Nobias technology: CrowdStrike: Is It Time To Buy This Cyber Security Stock After A Q4 Earnings Beat?
Looking at the community of credible authors that the Nobias algorithm tracks, we see that 92% of recent articles have expressed “Bullish” opinions on CRWD shares. Right now, the average price target being applied to CRWD by the credible Wall Street analysts that we track is $252.75. This represents upside potential of 36.7%. Since the company’s Q4 report on 3/9/2022, we’ve seen 7 credible Wall Street analysts (only those with 4 and 5-star Nobias ratings) update their price targets for CRWD shares. The average of these recently updated price targets is $261.43. This represents upside potential of approximately 41.4% relative to the stock’s current share price of $184.87.
We’ve seen numerous headlines related to cyber crimes in recent years. Just last week, news broke that hackers stole company data from Samsung related to its Galaxy devices. The Verge broke down this story in an article, highlighting the fact that the hacking out, named Lapsus$ claimed responsibility. The Verge report noted that Lapsus$ also recently hacked chip maker Nvidia as well.
Prior to the Russian invasion of Ukraine, The Hill highlighted recent warnings from U.S. government agencies that Russian cyber attacks could target U.S. infrastructure and/or private institutions in response to the aid that the United States has provided to Ukraine and the impending sanctions that were likely to go into place.
The Hill’s report read, “The Cybersecurity and Infrastructure Security Agency (CISA) has issued a "Shields Up" alert for American organizations saying that U.S. systems could face Russian cyberattacks amid warnings from Biden administration officials that a Russian invasion of Ukraine could be imminent.”
Recent 5G/internet of things innovation has led Wall Street analysts to speculate about the “5th Industrial Revolution”. A recent study published by the National Center for Biotechnology Information titled, “Is COVID-19 pushing us to the Fifth Industrial Revolution (Society 5.0)?” stated, “The fifth industrial revolution is dawning upon the world in unforeseeable ways as we increasingly rely on Industry 4.0 technologies including Artificial Intelligence (AI), Big Data (BD), the Internet of Things (IoT), digital platforms, augmented and virtual reality, and 3D printing.”
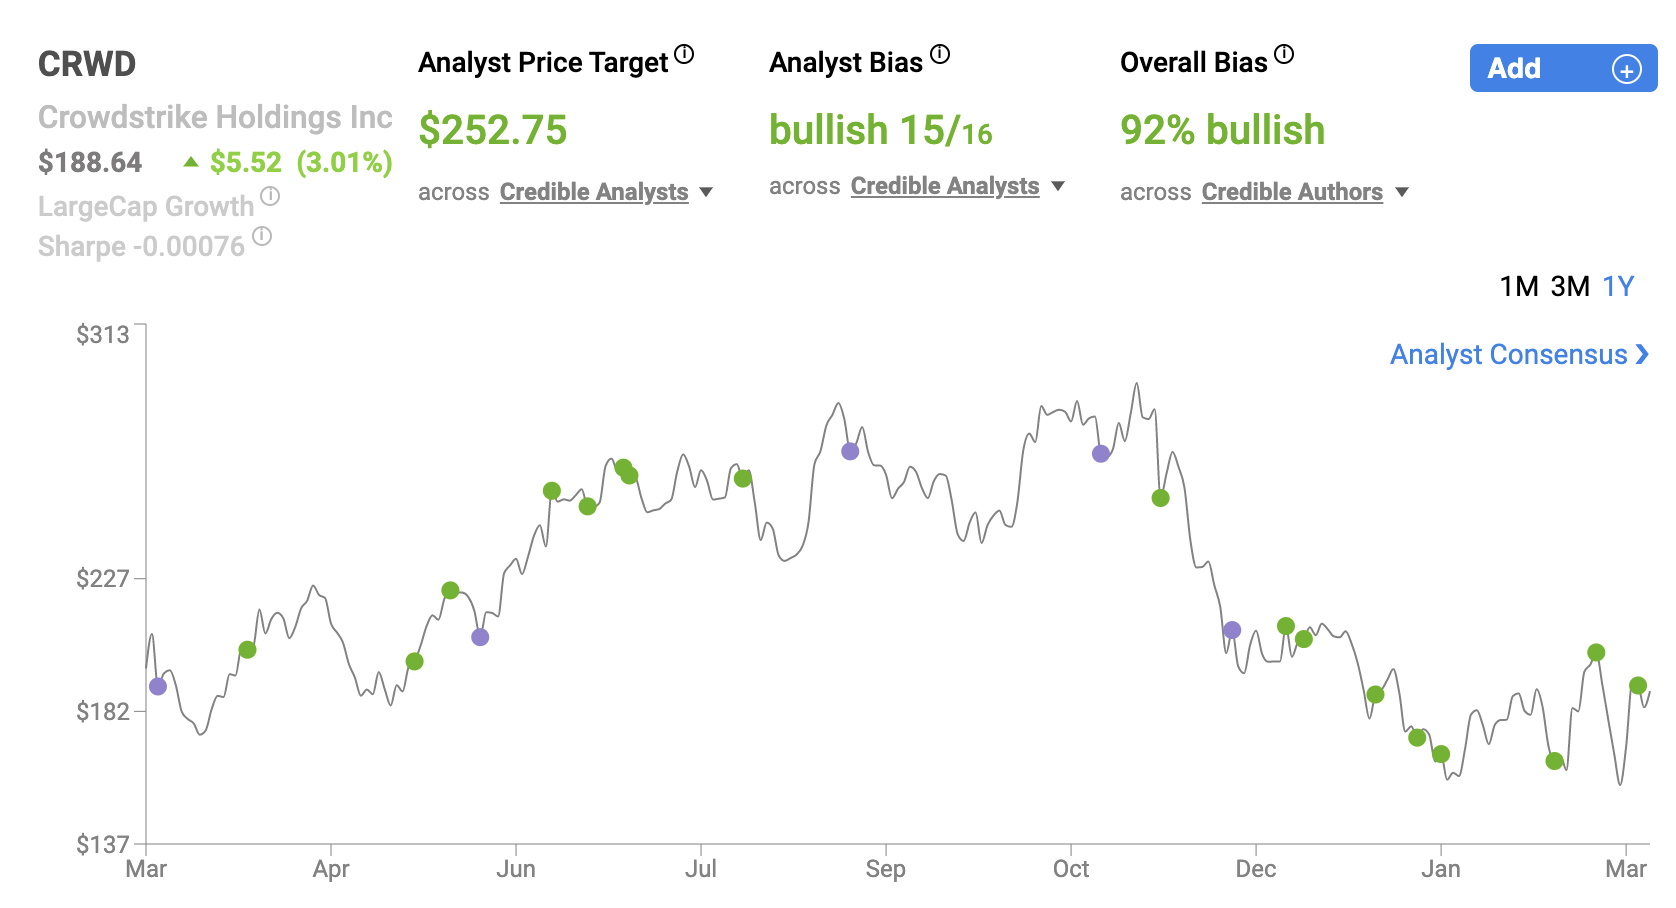
CRWD March 2022
The fact of the matter is, everyday the world forges further and further into the digital age. And, this has created a secular tailwind in the cybersecurity industry. However, in recent weeks, even with threats of state based cyber attacks on the rise, cybersecurity stocks have hold off.
During the trailing 30 days, the ETFMG Prime Cyber Security ETF (HACK) is down 3.98%. CrowdStrike (CWRD) is a popular stock in the cybersecurity space, with a market cap of $43.7 billion. CRWD shares are down 0.94% during the last month. CRWD is down 7.09% on a year-to-date basis. And, shares of this cybersecurity firm are down 38.3% from their 52-week high.
On February 15th, 2022, Michael Walen, a Nobias 5-star rated author, published a report on CRWD at The Markets Daily. Walen described CrowdStrike’s business model, saying: “CrowdStrike Holdings, Inc is a holding company, engaged in the provision of cloud-delivered solutions for next-generation endpoint protection that offers cloud modules on its Falcon platform through a SaaS subscription-based model. It operates through Domestic and International geographical segments.”
Regarding CRWD’s financials, Walen wrote: “CRWD stock has a market cap of $41.42 billion, a price-to-earnings ratio of -192.13, a PEG ratio of 17.72 and a beta of 1.44. The company’s 50-day moving average price is $188.90 and its 200-day moving average price is $233.70. The company has a current ratio of 1.90, a quick ratio of 1.90 and a debt-to-equity ratio of 0.77.” Also in mid-February, Graham Grieder, a Nobias 5-star rated author, posted an article on CrowdStrike, saying that its shares were at “Do or Die Territory” in terms of a share price turnaround.
Grieder began his piece saying, “The company IPO'd in 2019 and has performed very well since. At the peak, the stock was up almost 400% from the IPO price. Even today, it remains ~175% from the initial offering. Clearly, it has come under attack along with the rest of the growth/tech market, but is the story good enough to turn around?”
Regarding the company’s growth, Grieder was very bullish highlighting the company’s 67% ARR growth in recent years. However, when looking at a speculatively valued growth stock like CRWD, all that matters is what numbers the company produces moving forward.
Regarding future growth expectations, Grieder said, “So what did they expect to achieve in Q4? They were looking for $406.5-$412.3 million in revenue (53-56% growth). For the full year, this would take them to around $1.4 billion which is ~64% year-over-year. That's pretty good if you ask me.”
CRWD’s strong growth is the primary reason why Grieder believes an investor would be interested in buying CRWD shares. However, even with these strong expectations in mind, he questioned, “Will it be good enough for the market? That's the question.”
Bringing up the question, “Why sell?” Grieder highlighted the valuation concerns surrounding CRWD. He said, “The biggest risk is that all of the future growth is already priced in, and now we are starting to see the growth decelerate. Now, this is natural. There's no way the company is going to grow revenue at 60%+ year-over-year for the entirety of their lifespan.” He also touched upon a bearish macro environment, saying, “With inflation and yields rising, growth gets impacted even harder as future dollars become worthless and less what seems like every day. For the turnaround to happen, I think we need to see hard evidence that the current high inflation is in fact transitionary, and not here forever.”
Wrapping up his report, Grieder wrote, “As you can see, we are at a bit of a pivot point. A lot of it does depend on the macro market and where the economic winds shift with regards to growth stocks. But, the earnings report in early March will paint a clear short-term picture.”
Today, CRWD trades for $184.87. Part of the stock’s recent uptick in share price was based on CRWD’s recent Q4 report. CRWD reported Q4 earnings on March 9th, 2022 and beat analyst estimates on both the top and bottom lines.
The company’s revenue totaled $431 million, up 62.7% on a year-over-year basis. The company’s non-GAAP earnings-per-share came in at $0.31/share, beating analyst consensus estimates by $0.11/share. CrowdStrike provided investors with full-year fiscal 2023 guidance during their fourth quarter report. The company is calling for 2023 full-year revenues to arrive in a range of $2.133 billion-$2.163 billion, which represents approximately 47% y/y growth compared to fiscal 2022’s $1.45 billion revenue figure. The company is calling for non-GAAP income per share to arrive in a $1.03-$1.13 range, representing roughly 61.2% growth relative to 2022’s full-year non-GAAP income per share of $0.67.
Nicholas Ward is a Senior Investment Analyst at Wide Moat Research. He has spent the last 8 years writing about the stock market at various publications, including Seeking Alpha, The Street, Forbes Real Estate Investor, Sure Dividend, The Dividend Kings, iREIT, Safe High Yield, and The Intelligent Dividend Investor.
During the Q4 report George Kurtz, CrowdStrike’s co-founder and chief executive officer, said: "CrowdStrike once again delivered an exceptional fourth quarter and capped off a record year, achieving new milestones across both the top and bottom line.
Net new ARR of $217 million in the quarter was a new all-time high, driven by expansion of our leadership in the core endpoint market as well as a record quarter for cloud, identity protection and Humio. As our record results, growing scale and module adoption rates demonstrate, customers are increasingly leveraging the breadth and depth of the Falcon platform as they look to transform their security stack.” And, he isn’t the only one expressing bullish sentiment surrounding this company’s fundamentals and growth potential.
Looking at the community of credible authors that the Nobias algorithm tracks, we see that 92% of recent articles have expressed “Bullish” opinions on CRWD shares. Right now, the average price target being applied to CRWD by the credible Wall Street analysts that we track is $252.75. This represents upside potential of 36.7%. Since the company’s Q4 report on 3/9/2022, we’ve seen 7 credible Wall Street analysts (only those with 4 and 5-star Nobias ratings) update their price targets for CRWD shares. The average of these recently updated price targets is $261.43. This represents upside potential of approximately 41.4% relative to the stock’s current share price of $184.87.
Disclosure: Nicholas Ward has no position in CRWD. Nicholas Ward wrote this article for Nobias at their request with a view of giving investors a balanced perspective based on the writings of Nobias highly rated analysts and bloggers. Nobias has no business relationship with any company whose stock is mentioned in this article and does not have a position in this stock.
Additional disclosure: All content is published and provided as an information source for investors capable of making their own investment decisions. None of the information offered should be construed to be advice or a recommendation that any particular security, portfolio of securities, transaction, or investment strategy is suitable for any specific person. The information offered is impersonal and not tailored to the investment needs of any specific person.
Disclaimer: The Nobias star rating is based on past performance results and is not an indicator of future results. These past performance returns do not represent returns that any investor actually earned. Assumptions made include the ability to purchase the stocks recommended by the author under liquid markets where the transaction would be at the market price for the day. In reality, loss in liquidity may have a material impact on the returns that actually may have been earned. Further, returns are calculated without any including transaction costs, management fees, performance fees or expenses, or reinvestment of dividends and other income. This information is provided for illustrative purposes only.
BBBY with Nobias technology: Is Bed Bath & Beyond A Buy After Activist Investor Interest?
The confidence expressed by BBBY’s management team wasn’t enough to meaningfully bolster its shares price. However, last week, news broke that RC Ventures LLC, an investment firm managed by Ryan Cohen, who co-founded Chewy (CHWY) and is currently the Chairman of Gamestop (GME), took a 9.8% stake in BBBY and this news sent the stock soaring.
Bed Bath & Beyond has been a very volatile stock in recent weeks, rising by more than 60% before quickly retracing its steps, falling roughly 25% from its recent highs. On March 1st, Nobias 5-star rated author, Sarita Garza, covered BBBY in an article at The Markets Daily, highlighting the company’s business summary and recent earnings results.
Garzo wrote, “Bed Bath & Beyond, Inc engages in the operation of retail stores and retails domestics merchandise and home furnishings. Its products include domestic merchandise and home furnishings such as bed linens and related items, bath items, kitchen textiles kitchen and tabletop items, fine tabletop, basic house wares, general home furnishings, and consumables.” Garzo continued, “Bed Bath & Beyond (NASDAQ:BBBY) last posted its quarterly earnings results on Thursday, January 6th. The retailer reported ($0.25) earnings per share (EPS) for the quarter, missing the Thomson Reuters’ consensus estimate of $0.02 by ($0.27). The firm had revenue of $1.88 billion for the quarter, compared to analyst estimates of $1.95 billion. Bed Bath & Beyond had a negative net margin of 4.64% and a positive return on equity of 3.22%.”
BBBY shares sold off after this fiscal Q3 results, extending a period of share price weakness which has lasted for years. However, after these recent struggles, there has been a slew of insider buying activity of BBBY, as well as more recently, an activist investing firm going long the company’s shares. It appears that this insider/institutional demand has inspired the stock’s recent rally and we wanted to provide coverage of this activity to Nobias subscribers.
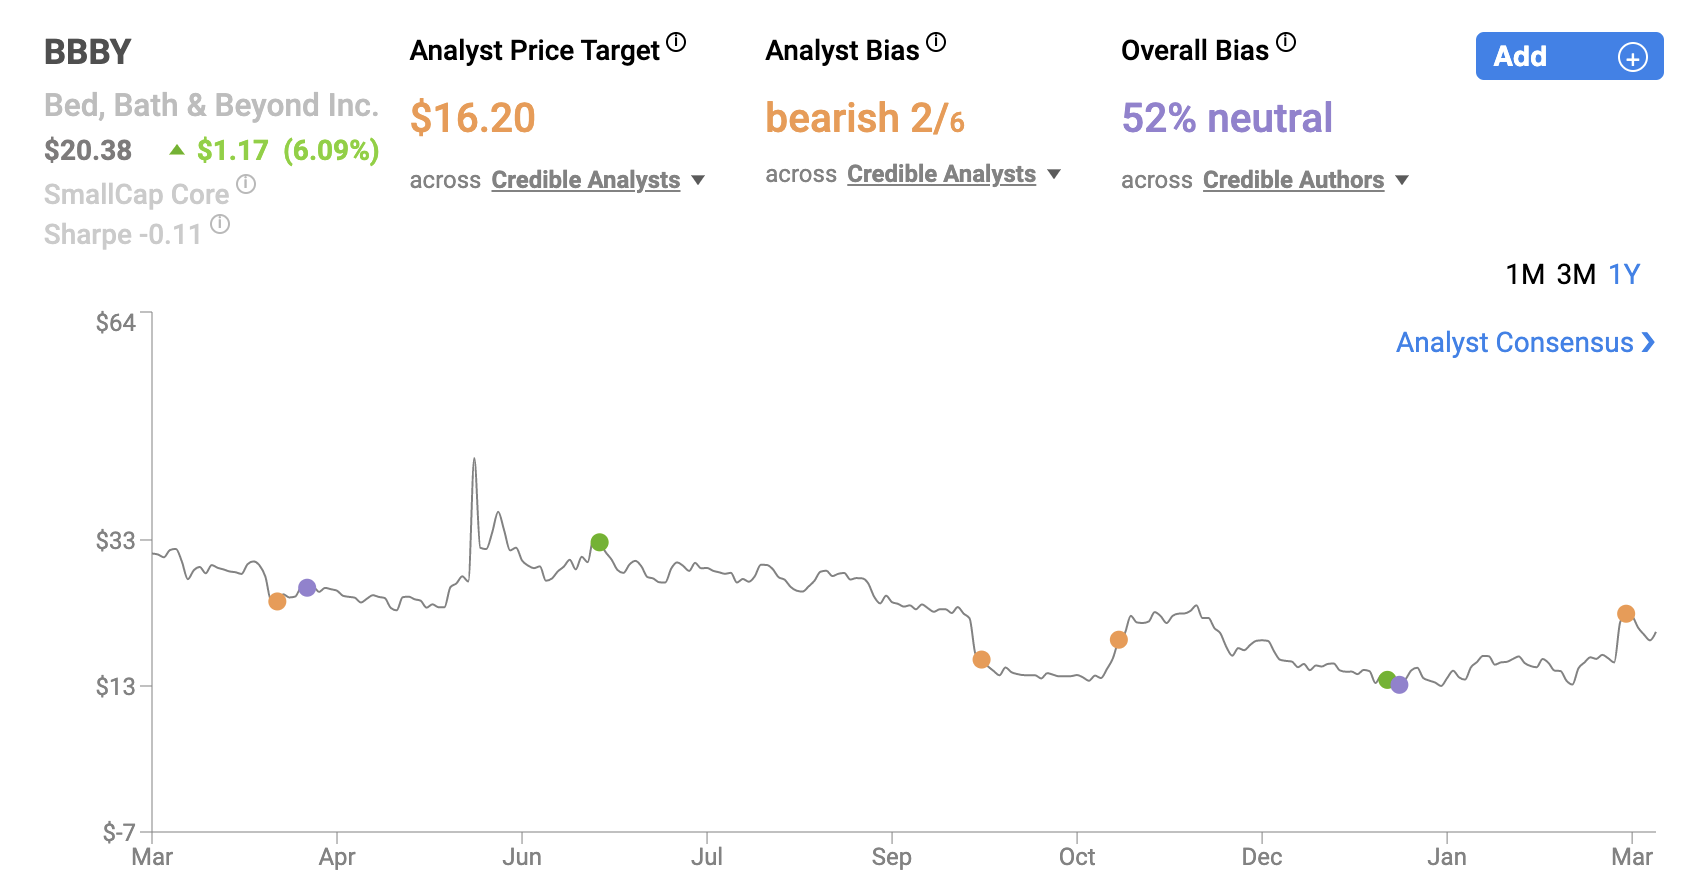
BBBY March 2022
In late January, Bed Bath & Beyond shares bounced on an SEC report highlighting an insider purchase by the company’s COO, John Hartman, bought $100,005.00 worth of shares at $15.00, upping his ownership to 700,166 shares of the company’s stock. However, this rally was relatively short-lived and in recent weeks, we saw BBBY sink down towards its 52-week low in the $12 range.
A recent report by Seeking Alpha news editor, Jessica Kuruthukulangara, shows that Hartman wasn’t the only insider buying into this recent weakness. Her report shows other recent insider purchases by members of BBBY’s management team and members of its Board of Directors.
Kuruthukulangara wrote:
CFO Gustavo Arnal bought 15K shares at $13.78-13.81/share, after which he now holds 333.2K shares.
Chief stores officer Gregg Melnick bought 7.2K shares at $13.79-13.84/share, following which he now owns 104K shares.
Chief merchandising officer Joseph Hartsig bought 5K shares at $13.78/share, after which he now holds 221.5K shares.
Chief customer officer Rafeh Masood bought 7K shares at $14/share, following which he now owns 153K shares.
Joshua Schechter, a BBBY director, bought 6K shares at $13.85-13.87/share, after which he now holds 35K shares.
The confidence expressed by BBBY’s management team wasn’t enough to meaningfully bolster its shares price. However, last week, news broke that RC Ventures LLC, an investment firm managed by Ryan Cohen, who co-founded Chewy (CHWY) and is currently the Chairman of Gamestop (GME), took a 9.8% stake in BBBY and this news sent the stock soaring.
Cohen, a popular figure in the retail industry because of his success at Chewy, sent a letter to BBBY’s Board of Directors, highlighting the rationale of his firm’s large investment. Cohen’s letter to BBBY’s Board of Directors stated: “We have carefully assessed Bed Bath’s assets, balance sheet, corporate governance, executive compensation, existing strategy and potential alternatives. While we like Bed Bath’s brand and capital allocation policy, we have concerns about leadership’s compensation relative to performance and its strategy for reigniting meaningful growth.”
Cohen noted that Bed Bath & Beyond, “is struggling to reverse sustained market share losses, stem years-long share price declines and navigate supply chain volatility.” Also, he noted, “the Company’s named executive officers were collectively awarded nearly $36 million in compensation last fiscal year – a seemingly outsized sum for a retailer with a nearly $1.6 billion market capitalization.”
Cohen’s letter pointed out BBBY’s recent performance issues. He noted that BBBY shares have a 1-year total return of -43.55%, a 3-year total return of 10.67%, a 5-year total return of -54.01%, a 10-year total return of -69.32%, and a 20.57% total return during the current tenure of CEO Mark Tritton.
In comparison’, Cohen points out that the S&P 500’s returns during these same periods of time all outpace BBBY’s by a wide margin. His letter stated that the S&P 500’s 1-year, 3-year, 5-year, 10-year, and CEO-matching returns were 16.47%, 63.10%, 98.81%, 284.91%, and 46.11%, respectively.
Cohen challenged BBBY’s current leadership, saying, “Almost two-and-a-half years into Mr. Tritton’s tenure, Bed Bath has underperformed the S&P Retail Select Industry Index by more than 58% on an absolute basis and is looking at an approximately 29% decline in full-year sales from pre-pandemic levels.” Cohen then moved onto a series of suggestions for the company’s Board to consider, which, in his opinion, has the potential to unlock significant value for shareholders. His letter stated, “We believe Bed Bath needs to narrow its focus to fortify operations and maintain the right inventory mix to meet demand, while simultaneously exploring strategic alternatives that include separating buybuy Baby, Inc. (“BABY”) and a full sale of the Company.”
Nicholas Ward is a Senior Investment Analyst at Wide Moat Research. He has spent the last 8 years writing about the stock market at various publications, including Seeking Alpha, The Street, Forbes Real Estate Investor, Sure Dividend, The Dividend Kings, iREIT, Safe High Yield, and The Intelligent Dividend Investor.
Cohen also brought up the potential to unlock shareholder value by selling the company outright to a private equity buyer, saying: “The final path we want to raise for consideration is a full sale of Bed Bath, in its current form, to one of the many well-capitalized financial sponsors with track records in the retail and consumer sectors and the ability to pay a meaningful premium.” He concluded his letter saying, “Hopefully leadership acts with urgency to implement the aforementioned suggestions. Given that I am the Chairman of GameStop and overseeing a systematic transformation, I am not in a position to join Bed Bath’s Board and personally drive the initiatives outlined in this letter. This does not mean, however, that RC Ventures will not seek to hold the Board and management accountable if necessary.” And, on this news, BBBY stock soared, with its share price rising from approximately $16.00/share to more than $26.00/share, or a single day rally of roughly 62.50%.
Since then, the exuberance surrounding BBBY shares has worn off and today, they trade for $19.99/share (meaning that they’ve lost roughly 27% of their value during the last 5 trading sessions). Yet, this $19.99/share price is still roughly 25% higher than BBBY traded for prior to Cohen’s letter, so it appears that the market has reacted positively, overall, to this activist investor news.
However, when looking at the credible authors and analysts that the Nobias algorithm tracks (only those with 4 and 5-star ratings) we see a more bearish outlook. Only 51% of the recent articles published on Bed Bath & Beyond by the credible authors that we track have expressed a “Bullish” opinion on BBBY shares. And, when looking at the price targets currently being applied to BBBY by the credible Wall Street analysts that we follow, we see that the average price target for this company is currently $16.20. This is essentially in-line with the level that BBBY traded at prior to Cohen’s letter. And, relative to the current $19.99 share price, it implies downside potential of nearly 19%.
Disclosure: Nicholas Ward has no position in any stocks mentioned in this article. Nicholas Ward wrote this article for Nobias at their request with a view of giving investors a balanced perspective based on the writings of Nobias highly rated analysts and bloggers. Nobias has no business relationship with any company whose stock is mentioned in this article and does not have a position in this stock.
Additional disclosure: All content is published and provided as an information source for investors capable of making their own investment decisions. None of the information offered should be construed to be advice or a recommendation that any particular security, portfolio of securities, transaction, or investment strategy is suitable for any specific person. The information offered is impersonal and not tailored to the investment needs of any specific person.
Disclaimer: The Nobias star rating is based on past performance results and is not an indicator of future results. These past performance returns do not represent returns that any investor actually earned. Assumptions made include the ability to purchase the stocks recommended by the author under liquid markets where the transaction would be at the market price for the day. In reality, loss in liquidity may have a material impact on the returns that actually may have been earned. Further, returns are calculated without any including transaction costs, management fees, performance fees or expenses, or reinvestment of dividends and other income. This information is provided for illustrative purposes only.
F with Nobias technology: Down 25% Year-To-Date, Could Ford’s EV Aspirations Turn The Stock Around?
Ford is vying to become one of the world’s leaders in the EV space over the coming decades and with that in mind, F shares could represent an attractive bargain for investors who aren’t interested in paying the speculative growth premiums usually associated with many of the EV companies and startups that exist in today’s market.
When most investors hear the phrase electronic vehicle, Tesla (TSLA) likely comes to mind. Or maybe, if you’re into emerging markets, a Chinese EV manufacturer, like NIO Inc (NIO) may take center stage in your mind’s eye. Depending on your tastes, one of the European Luxury companies may ring a bell. Or, maybe one of the new EV IPOs, like Rivian (RIVN) or Lucid (LCID) Motors seems most promising. In short, the U.S. legacy automakers famous for their traditional ICE (internal combustible engines) cars and trucks aren’t likely to be most investors’ top choices in the electric vehicle space. However, due to large investments and ongoing innovation from companies like the Ford Motor Company (F) this viewpoint may be outdated and flawed.
Ford is vying to become one of the world’s leaders in the EV space over the coming decades and with that in mind, F shares could represent an attractive bargain for investors who aren’t interested in paying the speculative growth premiums usually associated with many of the EV companies and startups that exist in today’s market.
Ford shares have struggled year-to-date, falling by 24.99% thus far during 2022. During the last month alone, F shares are down 9.58%, in large part, because of a disappointing Q4 report published in early February. However, even though F shares are currently out of favor in the market, Nobias 5-star rated author, Daniel Foelber, recently published an article titled, “Is Ford the Best EV Stock to Buy and Hold for Decades?” in which he expressed a very bullish outlook for shares.

F March 2022
Foelber noted Ford’s recent double digit post-earnings pullback; however, he said, “Impressive demand for electric vehicles (EVs) like the Mustang Mach-E SUV, the F-150 Lightning pickup, and the E-Transit electric van show promise that Ford's long-term goals remain intact.” Furthermore, he noted that the company’s long standing success in the ICE space is likely to translate into success in the EV space as well.
Foelber said, “According to Ford, its EV business moves faster and requires better vertical integration to be profitable. That means procuring parts, batteries, and chips ahead of time or producing batteries in-house to control more of the supply chain.” He continued, “Ford mentioned that having a superior supply chain, low operational costs, and efficient production can be key competitive advantages that will help its margins as it grows its EV business.” And, unlike several of its competitors, Foelber says that the company’s existing manufacturing expertise and unique capabilities have allowed Ford to produce profitable EV models from the start. He said, “The Mustang Mach-E is already profitable. But just in January, Ford identified $1,000 of cost savings it can implement for future models.”
With regard to the company’s profits, he said, “Ford is guiding for 2022 adjusted EBIT between $11.5 billion to $12.5 billion, which would be an increase of 15% to 25% compared to 2021. It would also give Ford a price-to-EBIT ratio of just 5.98, giving Ford an inexpensive valuation especially considering its growth rate.” Foelber highlighted Ford’s plans to use these profits to invest into future EV capacity. He said that the company plans to invest $11.4 billion into EV battery and vehicle manufacturing plants in Kentucky and Tennessee over the coming years, noting that doing so is “an extremely capital-intensive endeavor, but it's necessary if Ford wants to hit the goal to have EVs make up 40% of total sales by 2030, a goal that Ford reiterated on the investor call it is on track to hit.”
Ultimately, Foelber concluded his report by shining a very bullish light on F shares saying, “Given Ford's growth prospects, aggressive spending, dedication to growing battery and EV production, inexpensive valuation, high profitability, and its dividend, there's an argument that Ford is the single best all-around automotive stock for 2022 and beyond.”
Nobias 4-star rated author, Rekha Khandelwal, recently touched upon Ford’s EV aspirations in her report on the industry titled, “4 Supercharged Electric Vehicle Stocks to Buy in 2022 and Beyond”. With regard to Ford, Khandelwal wrote: “Ford Motor Company offers a relatively safer way to gain exposure to the EV growth story. While the stock may not rise as much as that of pure-play EV companies, the downside risk could also be less. Ford intends to make 40% to 50% of its vehicle sales electric by 2030. If Ford achieves that target, while also providing features like over-the-air software updates and other subscription and software services that can generate a recurring revenue stream for it, the company could see a meaningful uptick in its margins. That could pave the way for a steady rise in Ford's stock price.”
In a separate article focused on the electric vehicle industry titled, “3 Top EV Stocks to Buy During the Market Correction” Khandelwal highlighted Ford’s recent success in the marketplace. She said, “Ford is already executing on its electrification strategy. It intends to increase its EV production capacity to 600,000 vehicles by 2023. By 2030, the automaker aims to make 40% to 50% of its deliveries electric.” She continued, “The company is witnessing robust demand for its electric models. Ford sold 27,140 Mustang Mach-E vehicles in 2021, making it the second-best-selling electric SUV in the U.S., behind Tesla's Model Y. Similarly, its upcoming electric pickup truck, the F-150 Lightning, has received immense interest from buyers. The company already has 200,000 reservations for the truck, and deliveries are expected to begin in spring. All in all, Ford could well be a top beneficiary of the ongoing transition to electric vehicles.”
Nicholas Ward is a Senior Investment Analyst at Wide Moat Research. He has spent the last 8 years writing about the stock market at various publications, including Seeking Alpha, The Street, Forbes Real Estate Investor, Sure Dividend, The Dividend Kings, iREIT, Safe High Yield, and The Intelligent Dividend Investor.
The Value Pendulum, a Nobias 4-star rated author, recently published a more reserved article on Ford on Seeking Alpha, highlighting their “hold” opinion on shares. The Value Pendulum wrote: “In my opinion, Ford will eventually separate its ICE and EV businesses, and this is the key mid-to-long term catalyst for the stock that will increase the chances of its share price returning to $30 in the future. As with any company owning and operating multiple businesses, F suffers from a holding company or conglomerate discount. By having the EV business being spun off as a separate listed entity with its own independent market valuation, it will be much easier for investors to appreciate the growth of its EV segment and award a much higher valuation to the parent company, Ford.
Unfortunately, this catalyst is unlikely to be realized in the short term going by the company's comments.” Looking at the aggregate opinion of the credible authors tracked by the Nobias algorithm (only those with Nobias 4 and 5-star ratings) we see that 75% of recent articles published on Ford have expressed a “Bullish” opinion. Looking at the price targets being applied to Ford shares by credible (once again, 4 and 5-star rated) Wall Street analysts, we see an average price target of $22.40 currently being applied to F shares.
After its recent weakness, Ford currently trades for $16.04/share. Therefore, that average price target implies upside potential of approximately 38%.
Disclosure: Nicholas Ward has no position in any stocks mentioned in this article. Nicholas Ward wrote this article for Nobias at their request with a view of giving investors a balanced perspective based on the writings of Nobias highly rated analysts and bloggers. Nobias has no business relationship with any company whose stock is mentioned in this article and does not have a position in this stock.
Additional disclosure: All content is published and provided as an information source for investors capable of making their own investment decisions. None of the information offered should be construed to be advice or a recommendation that any particular security, portfolio of securities, transaction, or investment strategy is suitable for any specific person. The information offered is impersonal and not tailored to the investment needs of any specific person.
Disclaimer: The Nobias star rating is based on past performance results and is not an indicator of future results. These past performance returns do not represent returns that any investor actually earned. Assumptions made include the ability to purchase the stocks recommended by the author under liquid markets where the transaction would be at the market price for the day. In reality, loss in liquidity may have a material impact on the returns that actually may have been earned. Further, returns are calculated without any including transaction costs, management fees, performance fees or expenses, or reinvestment of dividends and other income. This information is provided for illustrative purposes only.
XOM with Nobias technology: Is Exxon A Buy With Oil At Record Highs?
With the U.S. economy looking strong and chastened energy producers now focusing more on shareholder returns than growth, we could see oil prices stay this high for some time, or even move higher on any type of geopolitical shock. Given that many oil producers currently trade at low multiples based on today's earnings, I wouldn't be surprised to see energy stocks outperform again this year.” And, being that we have seen a major “geopolitical shock”, it appears likely that Exxon’s (XOM) short-term prospects have improved.
Prior to the Russian Invasion of Ukraine, Nobias 4-star rated author, Billy Duberstein, published a report on The Motley Fool, in which he highlighted his outlook for energy sector stocks. Duberstein wrote: “Oil stocks were the best-performing segment of the market in 2021 -- especially the upstream producers. While some may think this was a short-term blip based on the rollout of vaccines, economic reopening, and supply constraints, prices could stay this high for a while.
The sector has been underinvesting in exploration and production for years, and while electric vehicles and clean energy alternatives are growing at a fast pace, they are still a small portion of the overall auto and energy markets.
With the U.S. economy looking strong and chastened energy producers now focusing more on shareholder returns than growth, we could see oil prices stay this high for some time, or even move higher on any type of geopolitical shock. Given that many oil producers currently trade at low multiples based on today's earnings, I wouldn't be surprised to see energy stocks outperform again this year.” And, being that we have seen a major “geopolitical shock” since Duberstein’s article was originally published, it appears likely that Exxon’s (XOM) short-term prospects have improved.
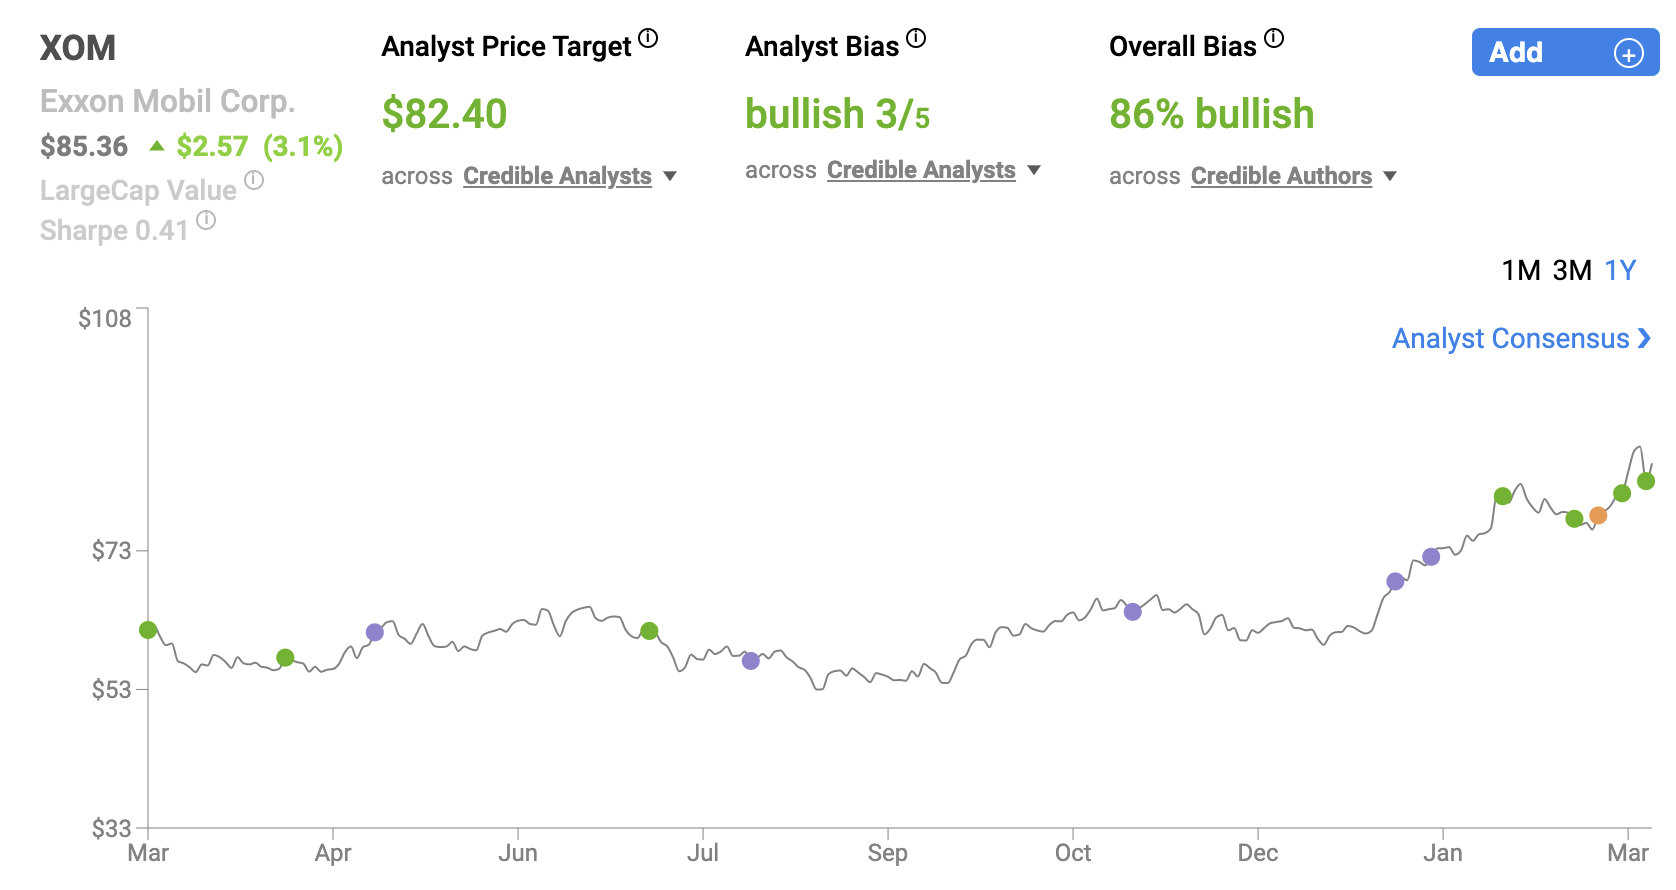
XOM March 2022
Since Russian forces invaded Ukraine on February 24th, 2022, The United States Oil ETF (USO) has increased in value by 29.4%. The price of WTI Crude has increased from approximately $92/barrel to $125.60/barrel since 2/24/2022 (approximately 36.5%). And, according to this CNBC report, U.S. gas prices (at the pump) hit record highs today as prices soared above the $4.00/gallon mark.
Exxon Mobil shares have benefitted from this rally as well. XOM shares are up 42.38% on a year-to-date basis. And yet, looking at the authors and analysts tracked by the Nobias algorithm, there is still a strong bullish lean associated with the stock (86% of articles published by credible sources recently have expressed “Bullish” sentiment).
Valuentum, a Nobias 4-star rated author, published a report on Exxon in early January titled, “Exxon Mobil Is A Valuentum Style Stock With A Hefty Dividend Yield” highlighting the stock’s attractive valuation. At a high level, Valuentum described the company’s operations, saying, “Exxon Mobil is involved in the exploration and production of crude oil/natural gas, and the manufacture of petroleum products as well as the transportation and sale of crude oil, natural gas and petroleum products. It also makes commodity petrochemicals.”
Regarding XOM’s valuation, the author wrote, “We think Exxon Mobil is worth $92 per share with a fair value range of $62-$122 per share.” Valuentum continued, “Our valuation model reflects a compound annual revenue growth rate of 15.5% during the next five years, a pace that is higher than the company's 3-year historical compound annual growth rate. Our valuation model reflects a 5-year projected average operating margin of 10.2%, which is above Exxon Mobil's trailing 3-year average. Beyond year 5, we assume free cash flow will grow at an annual rate of ~1% for the next 15 years and 3% in perpetuity. For Exxon Mobil, we use a 9% weighted average cost of capital to discount future free cash flows.”
Looking forward, Valuentum remained bullish on the company’s prospects, highlighting management’s commitment towards profitability. They wrote, “Exxon Mobil noted in its early December update that its capital expenditures would come in around ~$20-$25 billion from 2022-2027. Its investments are focused on operations in the Permian Basin, Guyana, Brazil, its’ liquefied natural gas ('LNG') business, and its petrochemical businesses.” For comparison’s sake, Valuentum wrote, “From 2010-2014, Exxon Mobil's annual capital expenditures averaged ~$33 billion (I, II).”
FInally, the author noted that the company hopes to use excess cash flows to buy back shares (which should further augment its bottom-line). They wrote, “During its third-quarter 2021 earnings update, Exxon Mobil announced that starting in 2022, it would begin repurchasing sizable amounts of its stock (buybacks were subdued during the 2018-2020 period). Its new stock buyback program will see the energy giant repurchase up to $10.0 billion of its shares over the 12-24 months starting in 2022.” In conclusion, Valuentum said that by reducing debt load (and therefore, interest expenses), improving its cost structure, and reducing its capex, “Exxon Mobil's initiatives are forecasted to double its earnings by 2027 from 2019 levels.”
Keith Speights, a Nobias 4-star rated author, also recently published a bullish report on the stock, titled, “3 Great Dividend Stocks to Buy That Are Trouncing the Market Right Now” which highlighted XOM’s appeal to income oriented investors. Speights wrote, “ExxonMobil has long been a favorite for income-seeking investors. With a dividend yield of 4.7%, it still is. The stock is even a Dividend Aristocrat with 39 consecutive years of dividend increases.” But, he said that an investment in XOM isn’t just about the dividend. In his opinion, the company offers strong growth prospects as well.
Speights wrote, “For one thing, the company's business appears to be the strongest it's been in years with ExxonMobil generating strong cash flows.” He continued, “ExxonMobil also recently discovered two new oil reservoirs off the coast of Guyana. The company thinks these sites will add to its previous estimate of 10 billion oil-equivalent barrels from its off-shore rigs in the area.”
More recently, on March 2, 2022, Graham Grieder, a Nobias 5-star rated author, published a report titled, “Exxon Mobil Is Still A Buy At $110 Oil” expressing his bullish opinion on XOM shares, even after the huge alpha that shares have posted throughout 2022.
Grieder wrote, “It's hard to believe, but we saw oil close at over $100 a barrel, and it hasn't slowed down since. This is welcome news for Exxon Mobil (XOM) shareholders. Unfortunately, it is coming on the back of war in Ukraine. How much higher can oil go? Will we see $150 once again? Either way, Exxon is going to be a cash machine. You can bet shareholders will be rewarded handsomely if we see this continue for some time. It's not too late to get in.”
Grieder breaks down Exxon’s cash flow potential, stating, “In 2021, the breakeven price worked out to $41. This means they covered their CapEx and dividends at $41 per barrel. Keep in mind it's currently trading around $110. So, what does that mean? Well, for every $1 increase in the price of oil, Exxon sees ~$475 million cash in earnings.”
Grieder believes that one of the biggest benefits of higher oil prices for XOM is the company’s ability to repair its balance sheet. He wrote, “It means that Exxon is printing cash, and that means shareholders are going to get rewarded handsomely. With cash, comes flexibility. Exxon is going to make paying down debt further a priority. In 2021, we saw $20 billion fall off the balance sheet, and that trend likely continues in 2022. As of right now, analysts are expecting to see the net debt land around $34 billion by year's end.”
Nicholas Ward is a Senior Investment Analyst at Wide Moat Research. He has spent the last 8 years writing about the stock market at various publications, including Seeking Alpha, The Street, Forbes Real Estate Investor, Sure Dividend, The Dividend Kings, iREIT, Safe High Yield, and The Intelligent Dividend Investor.
Grieder notes that is the case, XOM’s leverage ratio could fall to below 0.50x (well below the 5.0x levels that the company posted in 2020). He continues, “That is an incredible turn of events and it's all thanks to the price of oil. It's very likely that if we continue to see elevated oil prices throughout 2022 and 2023 that that number gets even closer to 0.”
Like Valuentum, Grieder mentioned XOM’s buyback as a bullish tailwind for shares. With oil selling for $100+/barrel, Grieder wrote, “As of now, the buyback program for 2022 is only at $10 billion. If we see $100+ oil last for weeks, or better yet months, there is no doubt in my mind that will get increased as well.”
Concluding his article, Grieder mentioned that oil markets are likely to stay “very volatile” in the short-term. However, he said, “Anything over $70 [regarding oil prices] is extremely bullish for Exxon.” Although, he did provide a bit of caution to overly optimistic investors after Exxon’s recent share price rally, saying, “It is not too early to get to in Exxon, or oil in general. But please, set stops. Do not get burnt on the turnaround. It will without a doubt eventually come, and it will come quickly.”
When looking at the average price target being applied to Exxon shares by the credible (4 and 5-star rated) Wall Street analysts that the Nobias algorithm tracks, it appears that this cautious optimism is warranted. Right now, the average price target applied to XOM shares by credible analysts is $82.40. Today, XOM shares trade for $85.36, meaning that this price target implies downside potential of approximately 5%.
Disclosure: Nicholas Ward has no position in any stocks mentioned in this article. Nicholas Ward wrote this article for Nobias at their request with a view of giving investors a balanced perspective based on the writings of Nobias highly rated analysts and bloggers. Nobias has no business relationship with any company whose stock is mentioned in this article and does not have a position in this stock.
Additional disclosure: All content is published and provided as an information source for investors capable of making their own investment decisions. None of the information offered should be construed to be advice or a recommendation that any particular security, portfolio of securities, transaction, or investment strategy is suitable for any specific person. The information offered is impersonal and not tailored to the investment needs of any specific person.
Disclaimer: The Nobias star rating is based on past performance results and is not an indicator of future results. These past performance returns do not represent returns that any investor actually earned. Assumptions made include the ability to purchase the stocks recommended by the author under liquid markets where the transaction would be at the market price for the day. In reality, loss in liquidity may have a material impact on the returns that actually may have been earned. Further, returns are calculated without any including transaction costs, management fees, performance fees or expenses, or reinvestment of dividends and other income. This information is provided for illustrative purposes only.
TGT with Nobias technology: Are Target Shares Still Attractive After Their Post-Earnings Rally?
Target was a popular stock in 2021. The company grew its earnings-per-share by 44% last year. However, during the first two months of the year, TGT shares were down roughly 13.5%. This weakness put Target on the radar of many value investors. However, the sentiment surrounding Target shares recently shifted. TGT reported Q4 earnings on March 1st and since then, its shares have risen by approximately 12%.
We’ve noticed an uptick in articles/reports published on Target (TGT) shares in recent weeks, due to the company’s volatility. In early 2022, Target shares experienced a double digit sell-off. However, more recently, the company posted its Q4 earnings report, which inspired a double digit bounce back rally.
Target was a popular stock in 2021. The company grew its earnings-per-share by 44% last year. However, during the first two months of the year, TGT shares were down roughly 13.5%. This weakness put Target on the radar of many value investors. However, the sentiment surrounding Target shares recently shifted. TGT reported Q4 earnings on March 1st and since then, its shares have risen by approximately 12%.
Here we highlight the data reported by the credible authors/analysts that the Nobias algorithm tracks coming into the Q4 report, as well as the current slate of opinions being expressed by these individuals, to see whether or not Target shares are still an attractive bargain, even after their recent double digit rally.
Sean Solarzano, a Nobias 4-star rated author, recently published a report breaking down Wall Street’s expectations for Target’s fourth quarter earnings report. He said, “Wall Street analysts expect that Target Co. (NYSE:TGT) will announce earnings per share (EPS) of $2.86 for the current quarter, Zacks Investment Research reports.” Solarzano continued, “Eight analysts have provided estimates for Target’s earnings, with the highest EPS estimate coming in at $3.01 and the lowest estimate coming in at $2.52. Target posted earnings per share of $2.67 during the same quarter last year, which indicates a positive year-over-year growth rate of 7.1%.”

TGT March 2022
Solarzano also touched upon full-year expectations and 2022 estimates, saying, “On average, analysts expect that Target will report full-year earnings of $13.19 per share for the current fiscal year, with EPS estimates ranging from $12.85 to $13.40. For the next financial year, analysts anticipate that the business will report earnings of $13.24 per share, with EPS estimates ranging from $11.00 to $13.77.”
Amy Baxter, a Nobias 4-star rated author published a report in mid-February that seemed to predict a solid beat during Q4, based upon recent foot traffic data in Target stores. She wrote, “Target is having an exceptional period of foot traffic, according to recent data from Placer.ai.” Baxter continued, “In fact, Target is outpacing Walmart when it comes to customer visits, while both retailers are facing ongoing challenges exacerbated by the COVID-19 pandemic.”
Regarding Target’s largest competitor, Baxter said, “Walmart saw visits down 2.5% in November, up 0.3% in December last year and down 3.1% in January 2022.” Baxter noted that this was a period of time which was heavily impacted by the Omicron variant. There were concerns that Omicron might disrupt the important holiday spending season for big-box retail names such as Walmart and Target. However, as you can see below, Target’s foot traffic data came in relatively strong.
Baxter wrote, “Target’s figures were even more impressive, with visits up 3.8% in November, 5.2% in December and 6.2% in January compared to those same months in 2019 and 2020.” She concluded her piece with a quote from Placer.ai reported which was bullish for the future of the industry as a whole; the research firm said, “The clear takeaway is that the two retail giants do not appear to be on any sort of direct collision course, and instead seem to be finding unique ways to complement each other for the wider consumer audience.”
On February 28th, right before Target’s March 1st report, Alanna Baker, a Nobias 5-star rated author published a quick note on the company, highlighting its fundamentals coming into the Q4 print. Baker wrote, “TGT opened at $199.22 on Monday. The company has a debt-to-equity ratio of 0.84, a quick ratio of 0.33 and a current ratio of 0.97. The stock has a market capitalization of $95.45 billion, a P/E ratio of 14.66, a P/E/G ratio of 1.15 and a beta of 1.00. The company’s 50-day simple moving average is $217.37 and its two-hundred day simple moving average is $236.29. Target Co. has a 52-week low of $166.82 and a 52-week high of $268.98.”
Also in late February, Daniel Schönberger, a Nobias 4-star rated author, published a bullish article on Target titled, “Target: Undervalued Again”. Daniel Schönberger was bullish on Target’s Q4 prospects coming into the recent quarter saying, “When looking at the quarterly results, growth is slowing down again – for revenue as well as operating income and earnings per share. But that is not a problem and should be expected. Target could report revenue growth of 20% or more for four consecutive quarters and almost double-digit revenue growth for seven consecutive quarters (in Q2/21, revenue grew 9.38%). These are phenomenal growth rates for a mature business like Target and we should not expect similar results anytime soon.”
Regarding the company’s likely growth slowdown, Schönberger wrote, “It should be obvious that Target will not report similar growth rates in 2022 and the years to come as it did in the quarters since the pandemic began. But it should also be obvious that Target does not have to grow at such high rates in order to be fairly valued and to be a good investment.”
Schönberger touched upon Target’s ongoing store-count expansion and remodel activity as a potential catalyst for Q4 and full-year 2021 growth. He wrote, “Target is continuing to open new stores, which will increase revenue. In the years 2013 till 2016, the number of total stores stagnated a little bit, but in the last few years the company is constantly increasing the number of stores, and in 2021 Target opened 29 new stores as well as 2 supply chain facilities (as reported during Q3/21 earnings). The company is also continuing to remodel its stores – 30 in 2021 and more than 100 stores will get remodeled in the coming quarters.”
Furthermore, Schönberger said that the company’s share buyback activity has the potential to continue to bolster its bottom-line, even in the face of rising capex related to store remodeling. He said, “In the last 15 years, Target decreased the number of outstanding shares about 3.7% annually from 865 million in 2007 to 489 million right now. To continue with a similar pace at current stock prices, Target must spend about $3.5 billion in share buybacks annually; and considering a free cash flow of almost $6 billion in the last four quarters and $1.7 to $1.8 billion necessary for dividends, it certainly would be possible for Target to spend this amount. But when being a bit more conservative, we can assume Target to buy back between 2% and 3% of its outstanding shares annually in the years to come.” And, buybacks aren’t the only shareholder returns that Target is known for.
This company has been very generous with its dividend over the years as well. Schönberger touched upon this saying, “The company will become a dividend king this year with 50 consecutive years of dividend increases. And after Target increased the dividend more than 30% last time, I would not be surprised to see another raise between 10% and 20%. Right now, Target has a payout ratio of 26% when taking the current quarterly dividend and TTM earnings per share and there is clearly room for Target to increase the dividend again (even if earnings per share should stagnate in the next few quarters).” Ultimately, he concludes, “When looking at the two simple valuation metrics – price-earnings ratio and price-free-cash-flow ratio – Target seems cheap again.”
Schönberger wrote, “At the time of writing, Target is trading for 14.5 times earnings and therefore below the 10-year average of 16.5. While looking at the P/FCF ratio, Target is trading at 16.5 times free cash flow (and above the 10-year average of 14.2), but these are rather low valuation multiples for a solid, recession-proof business that can grow at a solid pace.” What’s more, he said, “And not only the P/E ratio and P/FCF ratio are indicating that Target is undervalued. When using a discount cash flow calculation, Target also seems to be trading below its intrinsic value again.”
Using his discounted cash flow calculation, Schönberger wrote, “When calculating with these numbers (and assuming 10% discount rate as well as 489 million diluted outstanding shares), we get an intrinsic value of $243.56 for Target.” On 3/1/2022, when the company posted its quarterly results, the bullish takes of these authors were validated. The company beat consensus estimates on the bottom-line, posting Q4 non-GAAP earnings-per-share of $3.19 (which was $0.34/share above Wall Street’s target). The company reported that same-store-traffic was up by 8.1%. This figure was on top of the strong 6.5% growth that TGT posted in the fourth quarter of 2020.
Nicholas Ward is a Senior Investment Analyst at Wide Moat Research. He has spent the last 8 years writing about the stock market at various publications, including Seeking Alpha, The Street, Forbes Real Estate Investor, Sure Dividend, The Dividend Kings, iREIT, Safe High Yield, and The Intelligent Dividend Investor.
For the full-year, Target’s management said, “GAAP EPS from continuing operations of $14.10 was 63.1 percent higher than last year, while Adjusted EPS of $13.56 grew 44.0 percent compared with 2020. Both GAAP and Adjusted EPS have more than doubled since 2019.” And, regarding sales, Target reported that it, “Delivered $106 billion in total revenue, having grown nearly $28 billion, or more than 35 percent over the past two years.”
During the Q4 report, Target’s Chairman and CEO, Brian Cornell, said: "Our strong fourth-quarter performance capped off a year of record growth in 2021, reinforcing the durability of our business model and our confidence in long-term profitable growth. As we look ahead, we'll keep investing and delivering on all that has earned the loyalty and trust of our guests; that starts with our outstanding team and includes continued differentiation through affordability, assortment, ease and convenience."
Overall, when looking at the credible authors that Nobias tracks, we see that the vast majority of individuals publishing articles on this company agree with this bullish outlook. 94% of articles recently published by 4 and 5-star rated authors included a “Bullish” opinion of the company. And, when looking at the credible Wall Street analysts that our algorithm tracks (once again, focusing only on those individuals with 4 and 5-star ratings) we see that the average price target that is currently being attached to TGT shares is $265.25. Therefore, at today’s $224.10 price - even after the recent share price rally - Target appears to be undervalued. Relative to the $265.25 price target mentioned above, shares currently offer upside potential of approximately 18.4%.
Disclosure: Nicholas Ward has no position in any stocks mentioned in this article; however, Target is high on his watch list and he may initiate exposure in the near-term. Nicholas Ward wrote this article for Nobias at their request with a view of giving investors a balanced perspective based on the writings of Nobias highly rated analysts and bloggers. Nobias has no business relationship with any company whose stock is mentioned in this article and does not have a position in this stock.
Additional disclosure: All content is published and provided as an information source for investors capable of making their own investment decisions. None of the information offered should be construed to be advice or a recommendation that any particular security, portfolio of securities, transaction, or investment strategy is suitable for any specific person. The information offered is impersonal and not tailored to the investment needs of any specific person.
Disclaimer: The Nobias star rating is based on past performance results and is not an indicator of future results. These past performance returns do not represent returns that any investor actually earned. Assumptions made include the ability to purchase the stocks recommended by the author under liquid markets where the transaction would be at the market price for the day. In reality, loss in liquidity may have a material impact on the returns that actually may have been earned. Further, returns are calculated without any including transaction costs, management fees, performance fees or expenses, or reinvestment of dividends and other income. This information is provided for illustrative purposes only.